ON THIS PAGE
Examples: Monitors
This section assumes that Test Agents (as many as are required by the monitors) have been created according to the section Creating and Deploying a New Test Agent.
Overview of Monitor Orchestration
Before you can create and start a monitor through the REST API, you must have a template on which to base the monitor defined in Control Center, as explained in the chapter Test and Monitor Templates. All parameters specified in that template as Template input then need to be assigned values when you create a monitor from it through the REST API.
Creating a Monitor
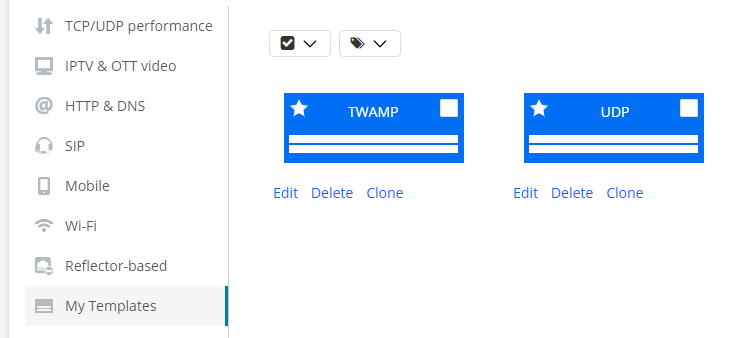
Suppose that two templates have been set up in Control Center: one for UDP monitoring between two Test Agent interfaces, and another where a Test Agent acts as TWAMP initiator towards a TWAMP reflector.
Below is Python code for listing the monitor templates in an account through the REST API:
# Request settings
# NOTE: User is able to pass additional parameters as a query string ?limit=100&offset=111:
# limit: Changes number of elements returned from API
# offset: Changes element from which results will be returned
url = '%s/accounts/%s/monitor_templates/%s' % (args.ncc_url, args.account, args.query_params)

# Get list of monitor templates
response = requests.get(url=url, headers={'API-Token': args.token})
The output will look something like this (below, two monitor templates have been defined):
{
  "count": 2,
  "items": [
    {
      "description": "",
      "id": 1,
      "inputs": {
        "clients": {
          "input_type": "interface_list"
        },
        "server": {
          "input_type": "interface"
        }
      },
      "name": "UDP"
    },
    {
      "description": "",
      "id": 2,
      "inputs": {
        "rate": {
          "input_type": "float"
        },
        "reflectors": {
          "input_type": "twamp_reflector_list"
        },
        "senders": {
          "input_type": "interface_list"
        },
        "time_sync": {
          "input_type": "string"
        },
        "time_sync_inband": {
          "input_type": "string"
        }
      },
      "name": "TWAMP"
    }
  ],
  "limit": 10,
  "next": null,
  "offset": 0,
  "previous": null
}
If you want to inspect just a single template, you can do so as follows, indicating the template's ID:
# Request settings
url = '%s/accounts/%s/monitor_templates/%s/' % (args.ncc_url, args.account, args.monitor_template_id)  # Template ID specified in last argument

# Get monitor template
response = requests.get(url=url, headers={'API-Token': args.token})
Continuing the previous example, if you run this code it will produce the output below:
{
  "description": "",
  "id": 1,
  "inputs": {
    "clients": {
      "input_type": "interface_list"
    },
    "server": {
      "input_type": "interface"
    }
  },
  "name": "UDP"
}
Now suppose you want to create a monitor based on the TWAMP template. This is done
using the POST operation for monitors. By default, the monitor will also start
immediately as a result of this operation (started defaults to
true). Alternatively, you can set started to False and use a
separate operation to start up the monitor: see the section Starting and Stopping a Monitor.
You need to provide values for the parameters under inputs, which
are left to be defined at runtime. The parameter names are those defined as
Variable name in Control Center. Here, they are simply
lowercase versions of the Control Center display names ("senders" vs. "Senders",
etc.).
Below is code supplying the required parameter settings for the monitor. For a monitor template with a different set of inputs, the details of this procedure will of course differ.
In this example, no alarm is associated with the monitor. For examples involving alarms, go to the section Creating a Monitor with an Alarm.
# Request settings
url = '%s/accounts/%s/monitors/' % (args.ncc_url, args.account)

# JSON content
json_data = json.dumps({
    'name': 'TWAMP monitor',
    'input_values': {
        'senders': {
            'input_type': 'interface_list',
            'value': [{
                'test_agent_id': 1,
                'interface': 'eth0',
                'ip_version': 4
            }]
        },
        'reflectors': {
            'input_type': 'twamp_reflector_list',
            'value': [1]
        },
        'rate': {
            'input_type': 'float',
            'value': 1.0
        },
        'time_sync': {
            'input_type': 'string',
            'value': '0'
        }
    },
    'started': True,  # Set this to False in order not to start the monitor
    'template_id': 1  # Reference to monitor template
})

# Create monitor
response = requests.post(url=url, data=json_data, headers={
    'API-Token': args.token,
    'Accept': 'application/json; indent=4',
    'Content-Type': 'application/json',
})
Some comments on the senders input value are helpful here to explain
how the input is structured.
This input value has input_type = interface_list,
so in its value you need to provide a list of Test Agent
interfaces. In the example above, a list of two interfaces is passed. For each
interface we need to specify the Test Agent ID, the Test Agent interface, and the IP
version to use.
Note that IPv6 is supported only for certain task types (as detailed in the support
documentation), so ip_version = 6 is a valid setting only for those
tasks.
Creating a Monitor with an Alarm
To associate an alarm with a monitor, you can either point to an alarm template that has been defined, or you can supply the entire alarm configuration with the POST operation. We will give one example of each approach below.
Setting Up a Monitor Alarm by Pointing to an Alarm Template
In order to make use of an alarm template, you must know its ID. To this end, first
retrieve all alarm templates as described in the section Retrieving All Alarm Templates and note the id value of
the relevant template. Suppose this ID is "3". You can then refer to that template
as follows:
# Request settings
url = '%s/accounts/%s/monitors/' % (args.ncc_url, args.account)

# JSON content
json_data = json.dumps({
    'name': 'Monitor from template with alarm template',
    'input_values': {
Supply monitor input values here as in the previous example.
    'started': True,         # Set this to False in order not to start the monitor
    'template_id': 1,        # Reference to _monitor_ template
    'alarm_configs': [{
        'template': 2,       # Reference to _test_ template
(Some optional parameters are omitted here.)
    }]
})

# Create monitor
response = requests.post(url=url, data=json_data, headers={
    'API-Token': args.token,
    'Accept': 'application/json; indent=4',
    'Content-Type': 'application/json',
})
Setting Up a Monitor Alarm by Configuring It Directly
Alternatively, you can set up an alarm for a monitor by supplying its entire configuration when creating the monitor, without referring to an alarm template. This is done as shown in the following example.
# Request settings
url = '%s/accounts/%s/monitors/' % (args.ncc_url, args.account)

# JSON content
json_data = json.dumps({
    'name': 'Monitor from template with alarm config.',
    'input_values': {
Supply monitor input values here.
    },
    'template_id': 1,
    'alarm_configs': [{
        'email': 1,
        'snmp': 1,
        'thr_es_critical': 7,
        'thr_es_critical_clear': 6,
        'thr_es_major': 5,
        'thr_es_major_clear': 4,
        'thr_es_minor': 3,
        'thr_es_minor_clear': 2,
        'thr_es_warning': 1,
        'thr_es_warning_clear': 0,
        'window_size': 60,
        'interval': 3600,
        'action': 'Action text',
        'send_only_once': False,
        'no_data_timeout': 1800,
        'snmp_trap_per_stream': False,
        'no_data_severity': 1  # CLEAR = 0 | WARNING = 1 | MINOR = 2 | MAJOR = 3 | CRITICAL = 4
    }]
})

# Create monitor
response = requests.post(url=url, data=json_data, headers={
    'API-Token': args.token,
    'Accept': 'application/json; indent=4',
    'Content-Type': 'application/json',
})
Starting and Stopping a Monitor
If the monitor was not configured to start at creation time (started
set to False), you need to apply a PUT or PATCH operation to start it (the two
operations are equivalent). Below, the PATCH operation is shown.
# Parameter settings for monitor
json_data = json.dumps({
"started": True
}
# Request settings
url = '%s/accounts/%s/monitors/%s/' % (args.ncc_url, args.account, args.monitor_id)
# Start monitor
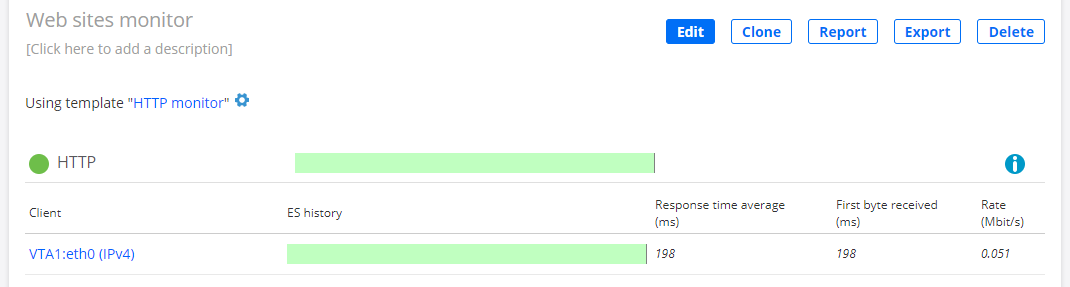
response = requests.patch(url=url, headers={'API-Token': args.token})The monitor is now started:
To stop the monitor, use the same operation but with started set to
False:
# Parameter settings for monitor
json_data = json.dumps({
    "started": False
}
Retrieving SLA Status and Data Metrics for a Monitor
Here is how to retrieve the SLA status and comprehensive data metrics for a monitor. This operation also fetches the complete configuration of the monitor.
By default, the SLA status is returned for each of the following time intervals: last
15 minutes, last hour, and last 24 hours. You can specify a different time interval,
replacing the default ones, by including the start and
end parameters in a query string at
the end of the URL. The time is given in UTC (ISO 8601) as specified in IETF
RFC 3339. An example is given below.
This operation can also return detailed data metrics for each task performed by the
monitor. You turn on this feature by setting with_detailed_metrics
to true (by default, this flag is set to false). The detailed data metrics are found
under tasks > streams > metrics
and are given for successive time intervals whose length are determined by the
resolution parameter. The default
and maximum resolution is 10 seconds. The resolution value entered is converted into
one of the resolutions available: 10 seconds, 1 minute, 5 minutes, 20 minutes, or 4
hours.
Averaged metrics are returned by default. You can turn these off by setting
with_metrics_avg to false in the query string. Average metrics
are by default computed for the last 15 minutes and are found in
tasks > streams >
metrics_avg. If you specify a different time interval by
start and end, averaged metrics will be
returned for that interval instead.
The output also includes monitor logs.
Example (with default resolution 10 seconds for detailed data metrics):
# Detailed metrics
with_detailed_metrics = 'true'

# Request settings
url = '%s/accounts/%s/monitors/%s/?with_detailed_metrics=%s' % (args.ncc_url, args.account, args.monitor_id, with_detailed_metrics)

# Get monitor
response = requests.get(url=url, headers={'API-Token': TOKEN})
The output will be similar to the following:
{
  "description": "This is a multisession TCP monitor",
  "gui_url": "https://localhost/dev/monitoring/11/?start=1507127679&end=1507128579",
  "id": 18,
  "last_15_minutes": {
    "end_time": "2017-10-04T14:49:39",
    "sla": 99.67,
    "sla_status": "acceptable",
    "start_time": "2017-10-04T14:34:39"
  },
  "last_24_hours": {
    "end_time": "2017-10-04T14:49:39",
    "sla": 99.98,
    "sla_status": "good",
    "start_time": "2017-10-03T14:49:39"
  },
  "last_hour": {
    "end_time": "2017-10-04T14:49:39",
    "sla": 99.86,
    "sla_status": "acceptable",
    "start_time": "2017-10-04T13:49:39"
  },
  "name": "MultiTCPMonitor",
  "report_url": "https://localhost/dev/monitoring/11/report_builder/?start=1507127679&end=1507128579",
  "started": true,
  "tags": [],
  "tasks": [
    {
      "name": "MultiTCP",
      "task_type": "multitcp",
      "config": {
        "acceptable_sla": 99.5,
        "client": {
          "ip_version": 4,
          "name": "eth1",
          "preferred_ip": null,
          "test_agent": 2
      },
      "connections": 100,
      "delay": 0,
      "direction": "down",
      "down_es_connected": 10,
      "down_es_rate": 0.2,
      "down_es_max_rate": 0.2,
      "good_sla": 99.95,
      "port": 5000,
      "server": {
        "ip_version": 4,
        "name": "eth1",
        "preferred_ip": null,
        "test_agent": 1
      },
      "up_es_connected": 10,
      "up_es_rate": 0.2,
      "up_es_max_rate": 0.2
    }
  ]
  "streams": [
    {
      "direction": "down",
      "gui_url": "https://localhost/dev/results/27/rrd_graph/?start=1507127679&end=1507128579",
      "id": 27,
      "is_owner": true,
      "metrics": [
        [
          "2017-10-04T13:34:39",
          "2017-10-04T13:34:49",
          "10",
          ... (remaining metrics omitted here)
        ]
        [
          ... (metrics for next 10 second interval)
        ]
        ... (further batches of metrics for successive 10 second intervals)
      ]
      "metrics_avg": {
        "start_time": "2017-10-04T14:34:39",
        "end_time": "2017-10-04T14:49:39",
        "active": 10,
        "connected": 10,
        "disconnected": 0,
        "es": 0.33,
        "es_connected": 0.33,
        "es_rate": 0.00,
        "rate": 12.49,
        "sla": 99.67,
        "sla_status": "acceptable"
      },
      "metrics_headers": [
        "start_time",
        "end_time",
        ... (rest omitted)
      ]
      "metrics_headers_display": [
        "Start time",
        "End time",
        ... (rest omitted)
      ]
      "name": "VTA1:eth1 (IPv4) (server) -> VTA2:eth1 (IPv4) (client)"
    }
  ],
  "last_3_logs": [
    {
      "level": "warning",
      "message": "Monitoring log message"
    }
  ]
}
Here is how to specify "start" and "end" times and the time resolution of detailed data metrics in a query string:
# Custom time interval
start = '2017-10-04T12:00:00.000000Z'
end = '2017-10-04T12:30:00.000000Z'

# Detailed metrics
with_detailed_metrics = 'true'

# Time resolution of metrics
resolution = '60'

# Request settings
url = '%s/accounts/%s/monitors/%s/?start=%s&end=%s&with_detailed_metrics=%s&resolution=%s' % (args.ncc_url, args.account, args.monitor_id, start, end, with_detailed_metrics, resolution)
You can also retrieve all monitors with their SLAs in one go. However, in this case,
no detailed data metrics are included in the export (the tasks >
streams item is omitted). This is to limit the size of the
output if the number of monitors is large.
# Request settings
url = '%s/accounts/%s/monitors/' % (args.ncc_url, args.account)

# Get monitor and its SLA
response = requests.get(url=url, headers={'API-Token': args.token})
Generating a PDF Report on a Monitor
You can generate a PDF report on a monitor directly from the REST API. The report has the same format as that generated from the Control Center GUI.
By default, the report covers the last 15 minutes. You can specify a different time
interval by including the start and end parameters
in a query string at the end of the URL. The time is given in UTC (ISO 8601) as specified
in IETF
RFC 3339.
In addition, the following options can be included in the query string:
worst_num: For each task in a monitor, you can specify how many measurement results to show, ranked by the number of errored seconds with the worst on top. The scope of a measurement result is task-dependent; to give one example, for HTTP it is the result obtained for one client. The default number is 30.graphs: Include graphs in the report.
Example:
# Include graphs
graphs = 'true'

# Request settings
url = '%s/accounts/%s/monitors/%s/pdf_report?graphs=%s' % (args.ncc_url, args.account, args.monitor_id, graphs)

# Get monitor
response = requests.get(url=url, headers={'API-Token': args.token})

print 'Status code: %s' % response.status_code
print json.dumps(response.json(), indent=4)