Example: Configuring Grafana as Reporting Tool
Introduction
This section describes how to query metrics in Control Center using Grafana.
Grafana is an open-source visualization and analytics software tool that lets you query, visualize, alert on, and explore metrics stored in a time-series database through tables and graphs.
This chapter requires a running instance of Grafana. You can download it from grafana.com/grafana/download and install it by following the instructions on that page.
Grafana allows you to create custom dashboards with multiple panels. Each panel uses a data source and runs a query against the data source. The query is defined using a query editor specific to the data source selected; in addition, the query editor manages the visualization options for the panel.
Setting Up the Data Source
Once Grafana is running, the next step is to define a data source for TimescaleDB so that Grafana can perform queries on the metrics. In the Preparations chapter, the section Connecting to TimescaleDB instructed you to configure the SSH tunneling in addition to the database connection settings. In Grafana, configuring the SSH tunneling and the connecting to the database happen in two distinct phases, as described in the following sections.
Configuring the SSH Tunnel
Given the following:
<Control Center IP/FQDN>, the IP or Fully Qualified Domain Name of the node where Control Center is running, and- 7432, the database port which TimescaleDB listens to,
the SSH tunnel between the Grafana and the TimescaleDB servers can be defined as follows:
- Open a terminal window on the server where Grafana is installed.
- Install the
openssh-serverpackage. - Copy the Control Center public key,
key.pub, into<path_to_key_pub>on the Grafana server. -
Run this command to set up background SSH port forwarding:
ssh -i <path_to_key_pub>/key.pub \
-o ExitOnForwardFailure=yes -f -L <local_port>:127.0.0.1:7432 \
<os_user>@<Control Center IP/FQDN> sleep 15

echo $?
where
<os_user>is the OS user in the TimescaleDB server and<local_port>is the port on the Grafana server that forwards the traffic to the TimescaleDB listening port.
The SSH tunnel is now set, and it is possible to define TimescaleDB as a data source in Grafana.
Defining the Data Source in Grafana
Once the SSH tunnel is active, the next step is to define a data source for TimescaleDB so that Grafana can perform queries on the metrics.
- Open your web browser and go to
http://<Grafana host IP/FQDN>:3000/. Here, 3000 is the HTTP port that Grafana listens to by default, and<Grafana host IP/FQDN>refers to the IP or Fully Qualified Domain Name of the node where Grafana is installed. - On the login page, enter the credentials for the admin user.
- Click the configuration symbol (cogwheel) on the left. On the Data sources tab, click the Add data source button. Search for "Postgres" and click Select.
-
Fill out the PostgreSQL data source form as shown in the image below. In this case, the data source name used in the next steps is "Metrics Database", and the value of
<local_port>is 9432.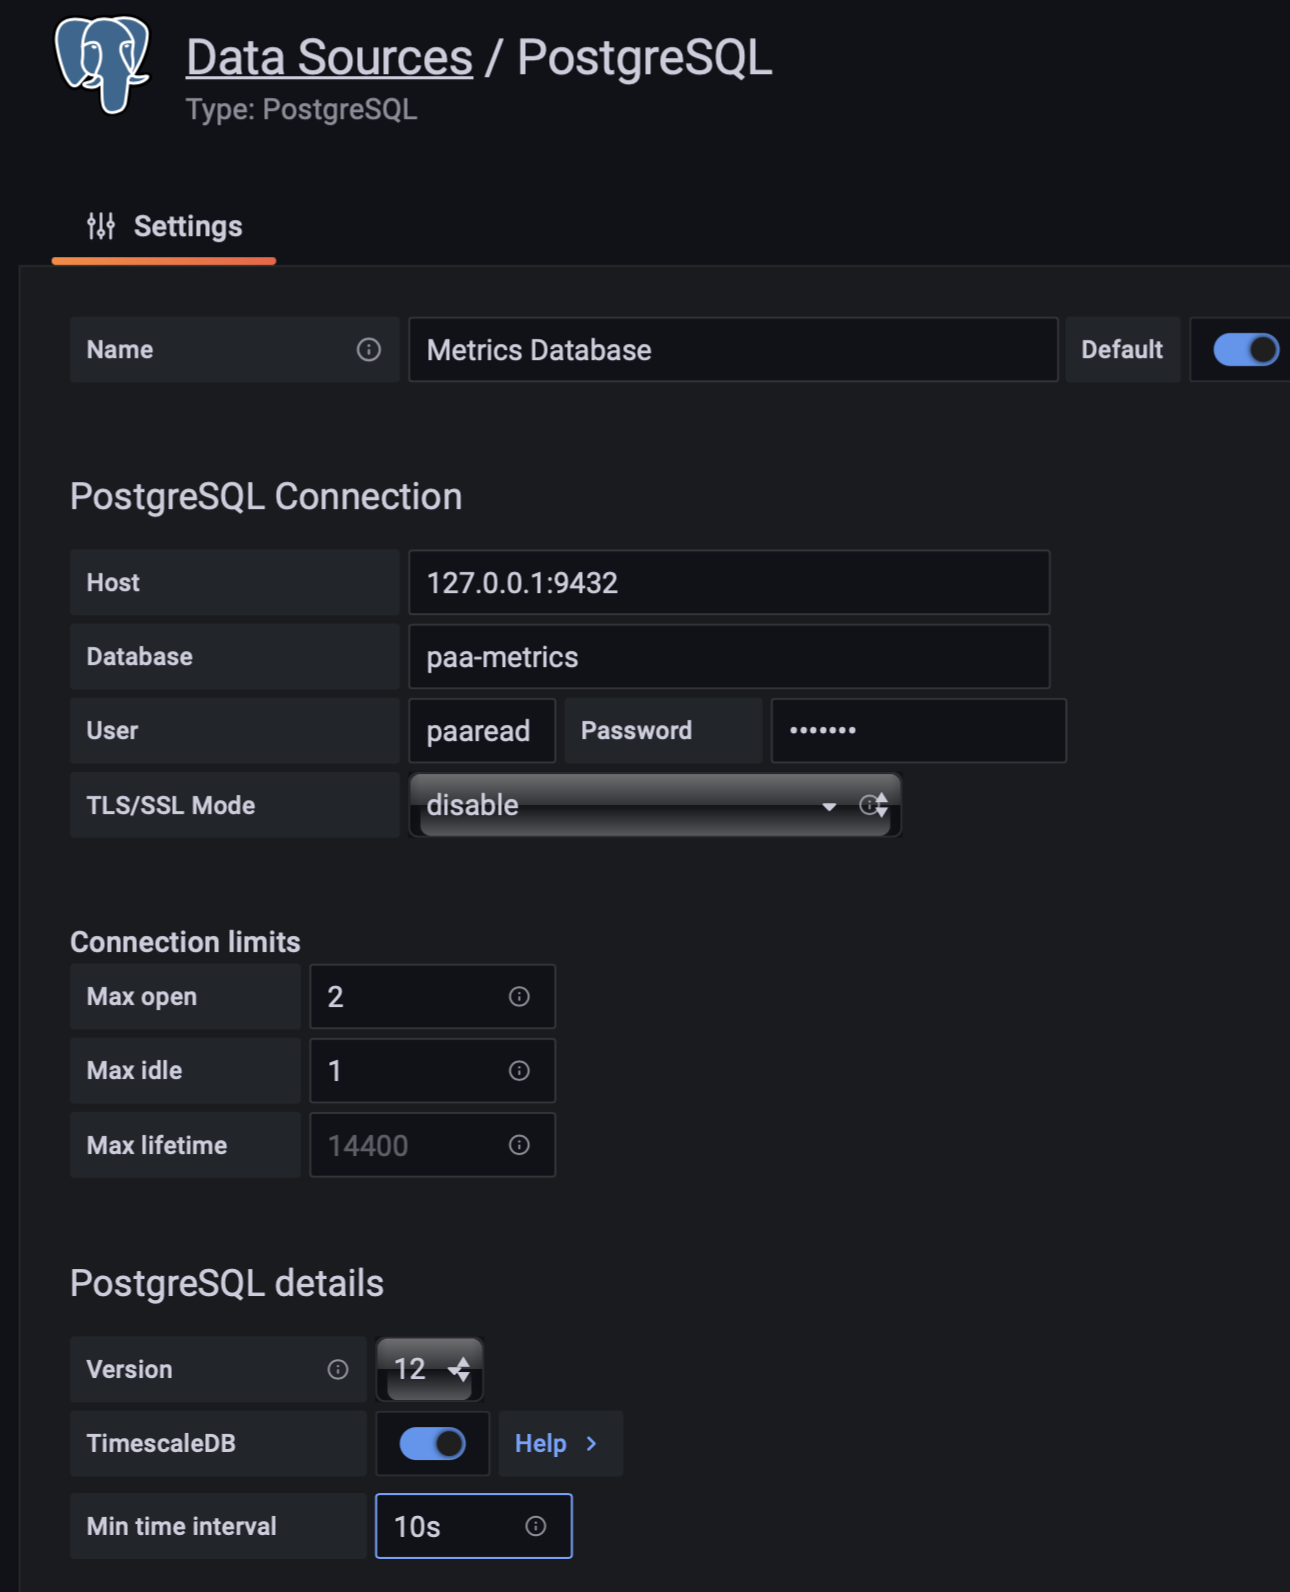
- Once you are done, click Save & test.
Creating a Dashboard
- On the sidebar, click the plus sign, then Dashboard and finally Add an empty panel.
- In the New dashboard/Edit panel view, go to the Query tab.
- Configure your query by selecting "Metrics Database" from the data source selector.
- Click Edit SQL to provide a query in raw SQL.
-
In the text field that appears, enter a query formatted like the one below for an HTTP monitor named "Stream 1". Note how the interval delimiters are replaced with the Grafana macros
$__timeFrom()and$__timeTo(). (More Grafana macros for PostgreSQL are available here: grafana.com/grafana/download)SELECT -- time field (alias "time" is required) time_bucket('30s',_time) as "time", -- metric percentile_cont(0.5) WITHIN GROUP (ORDER BY response_time_avg) as "avg_response_time" FROM -- data source vw_monitor_metrics_http WHERE -- time interval to analyze _time BETWEEN $__timeFrom() AND $__timeTo() AND -- stream identifier stream_name = 'Stream 1' AND -- account identifier account_short_name = 'account_1' GROUP BY "time" ORDER BY "time"; - Click the Query Inspector button to validate. Then, on the panel to the right, on the Query tab, click the Refresh button. Data will be visualized in the panel, and above the chart you can adjust the time interval to analyze.
- Click the Save icon in the top right corner of the screen to save the dashboard.
- Add a descriptive name, and then click Save.