Ejemplo: Configuración de muestreo para enrutadores de la serie MX
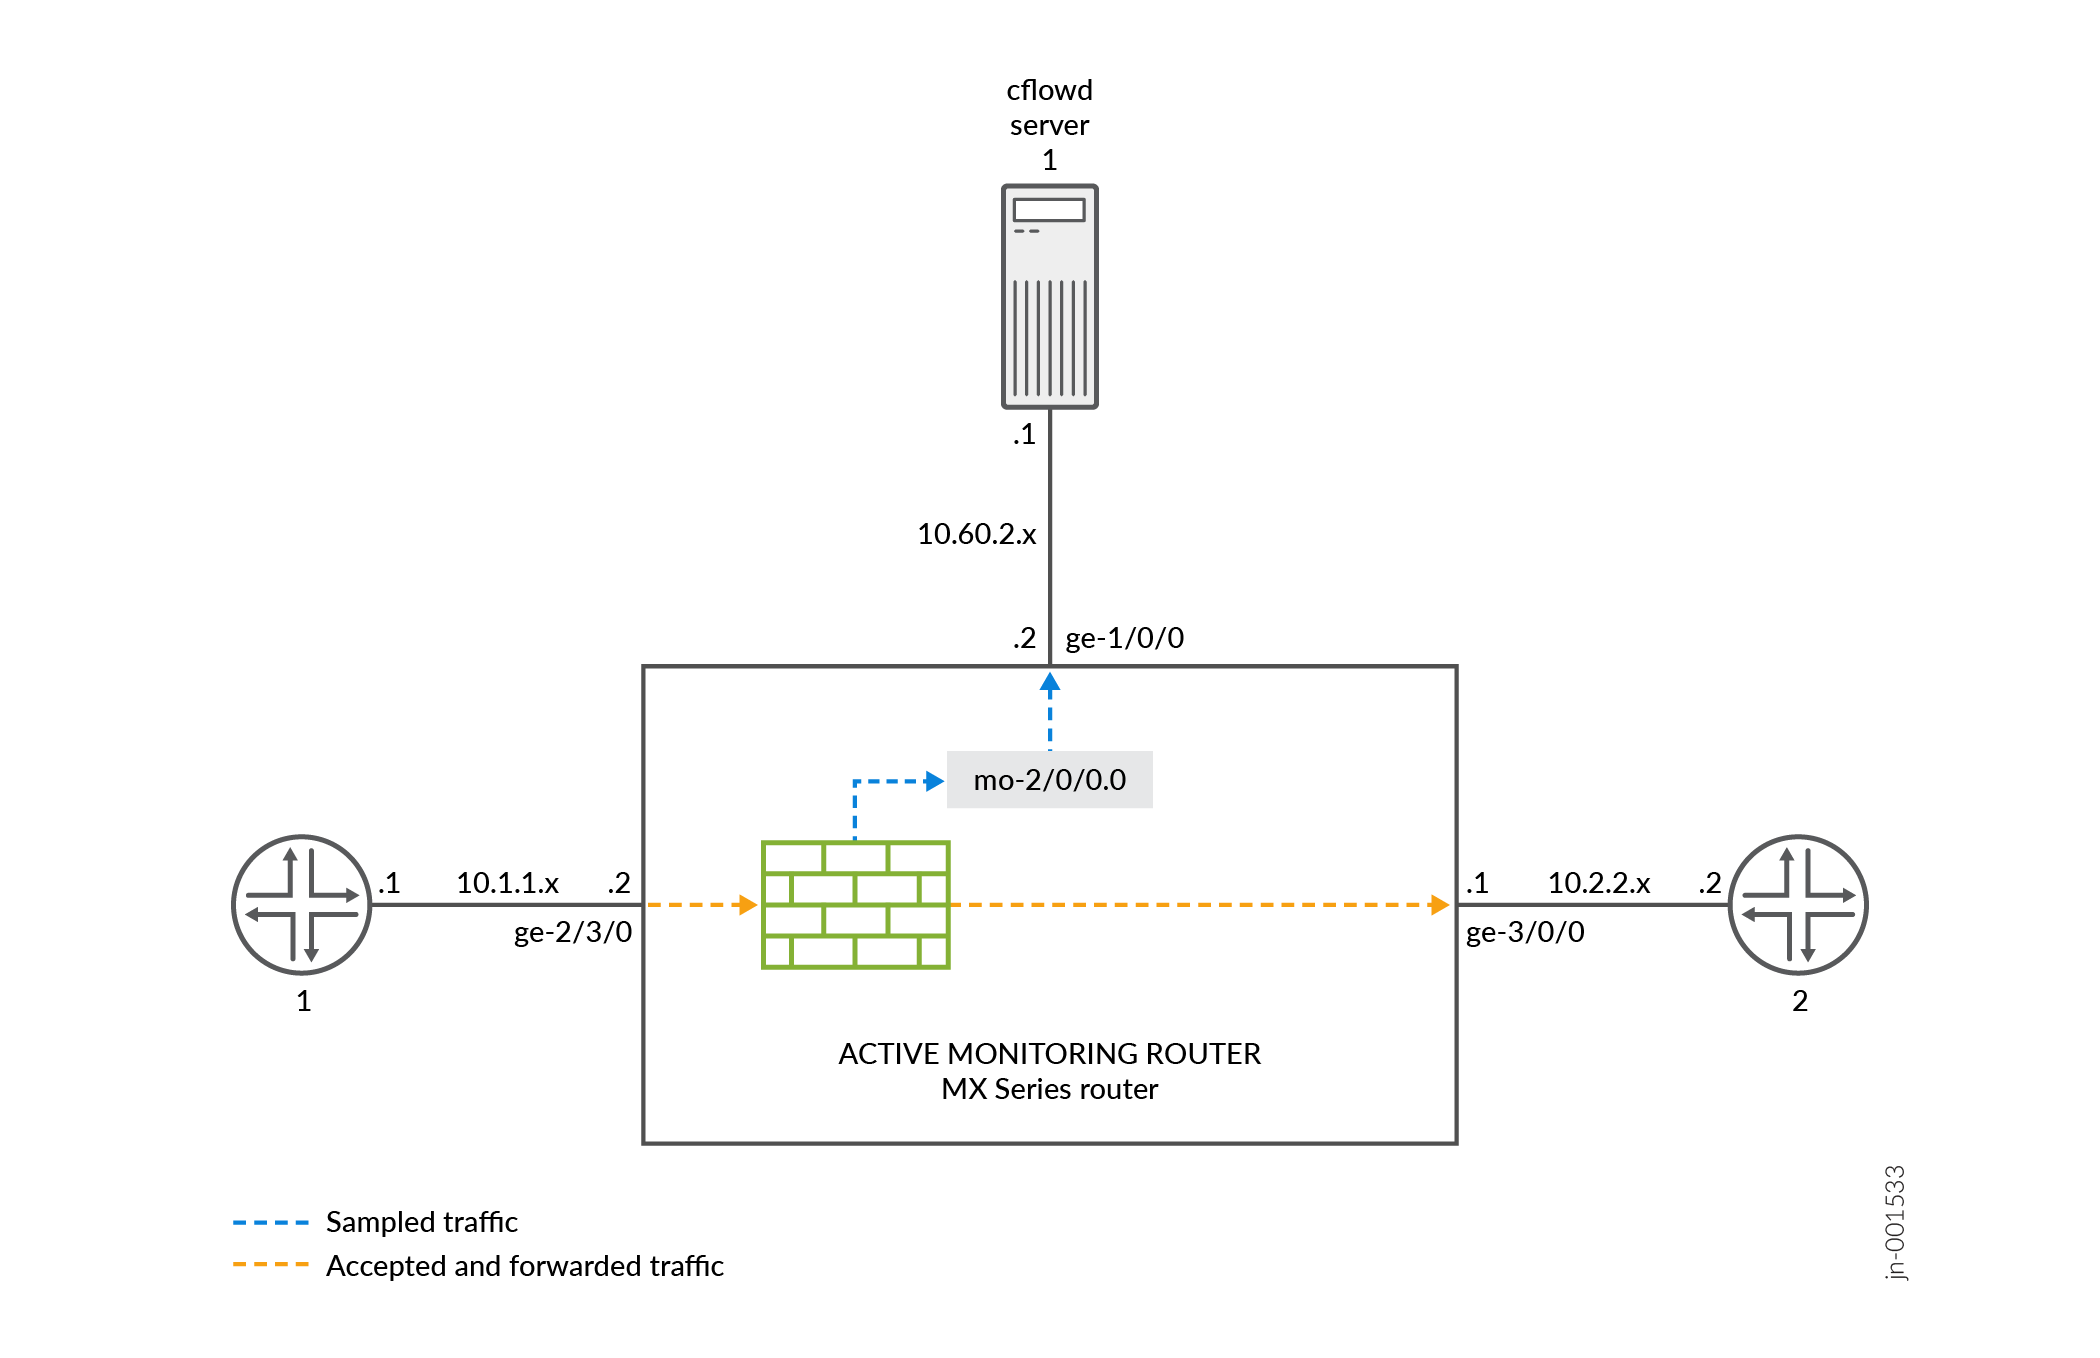
En la Figura 1, el tráfico del enrutador 1 llega a la interfaz Gigabit Ethernet ge-2/3/0 del enrutador de monitoreo. La interfaz de salida en el enrutador de supervisión que conduce al enrutador de destino 2 es ge-3/0/0. En la supervisión activa del flujo, tanto la interfaz de entrada como la de salida pueden ser de cualquier tipo de interfaz (como Gigabit Ethernet). La interfaz de exportación que conduce al servidor de flujo es ge-1/0/0.
Configure un filtro de firewall para muestrear, contar y aceptar todo el tráfico. Aplique el filtro a la interfaz de entrada y configure la interfaz de salida (para el reenvío de tráfico), la interfaz de servicios adaptables (para el procesamiento de flujos) y la interfaz de exportación (para exportar registros de flujo).
Configure el muestreo en el nivel jerárquico [edit forwarding-options] . Incluya la dirección IP y el puerto del servidor de flujo con la flow-server instrucción y especifique la interfaz de servicios adaptables que se utilizará para el procesamiento de registros de flujo con la interface instrucción en el nivel de [edit forwarding-options sampling] jerarquía.
Enrutador 1
[edit]
interfaces {
   sp-2/0/0 { # This adaptive services interface creates the flow records.
        unit 0 {
            family inet {
                address 10.5.5.1/32 {
                    destination 10.5.5.2;
                }
            }
        }
    }
   ge-1/0/0 { # This is the interface where records are sent to the flow server.
        unit 0 {
            family inet {
                address 10.60.2.2/30;
            }
        }
    }
   ge-2/3/0 { # This is the input interface where all traffic enters the router.
        unit 0 {
            family inet {
                filter {
                   input catch_all; # This is where the firewall filter is applied.
                }
                address 10.1.1.1/20;
            }
        }
    }
   ge-3/0/0 { # This is the interface where the original traffic is forwarded.
        unit 0 {
            family inet {
                address 10.2.2.1/24;
            }
        }
    }
}
forwarding-options {
   sampling { # Traffic is sampled and sent to a flow server.
        input {
           rate 1; # Samples 1 out of x packets (here, a rate of 1 sample per packet).
        }
        family inet {
            output {
               flow-server 10.60.2.1 { # The IP address and port of the flow server.
                    port 2055;
                    version 5; # Records are sent to the flow server using version 5 format.
                }
                flow-inactive-timeout 15;
                flow-active-timeout 60;
                interface sp-2/0/0 { # Adding an interface here enables PIC-based sampling.
                    engine-id 5; # Engine statements are dynamic, but can be configured.
                    engine-type 55;
                    source-address 10.60.2.2; # You must configure this statement.
                }
            }
        }
    }
}
firewall {
    family inet {
        filter catch_all { # Apply this filter on the input interface.
            term default {
                then {
                    sample;
                    count counter1;
                    accept;
                }
            }
        }
    }
}
Verificar su trabajo
Para verificar que su configuración es correcta, utilice los siguientes comandos en la estación de monitoreo que está configurada para el monitoreo de flujo activo:
show services accounting errorsshow services accounting (flow | flow-detail)show services accounting memoryshow services accounting packet-size-distributionshow services accounting statusshow services accounting usageshow services accounting aggregation template template-name name (detail | extensive | terse)(Solo versión 9)
La mayoría de los comandos del modo operativo de monitoreo de flujo activo contienen información de salida equivalente a los siguientes comandos de monitoreo de flujo pasivo:
show services accounting errors =show passive-monitoring errorshow services accounting flow =show passive-monitoring flowshow services accounting memory =show passive-monitoring memoryshow services accounting status =show passive-monitoring statusshow services accounting usage = show passive-monitoring usage
Los comandos de monitoreo de flujo activo se pueden usar con la mayoría de las aplicaciones de monitoreo de flujo activo, incluidos el muestreo, la contabilidad de descarte, la duplicación de puertos y la duplicación de puertos múltiples. Sin embargo, puede utilizar los comandos de supervisión de flujo pasivo solo con configuraciones que contengan un grupo de supervisión en el [edit forwarding-options monitoring] nivel jerárquico.
A continuación, se muestra el resultado de los show comandos utilizados con el ejemplo de configuración:
user@router1> show services accounting errors
Service Accounting interface: sp-2/0/0, Local interface index: 542
Service name: (default sampling)
  Error information
    Packets dropped (no memory): 0, Packets dropped (not IP): 0
    Packets dropped (not IPv4): 0, Packets dropped (header too small): 0
    Memory allocation failures: 0, Memory free failures: 0
    Memory free list failures: 0
    Memory overload: No, PPS overload: No, BPS overload: Yes

user@router1> show services accounting flow-detail limit 10
Service Accounting interface: sp-2/0/0, Local interface index: 468
Service name: (default sampling)
Protocol   Source         Source  Destination Destination    Packet        Byte
           Address          Port  Address            Port     count       count
udp(17)    10.1.1.2           53  10.0.0.1             53      4329     3386035
ip(0)      10.1.1.2            0  10.0.0.2              0      4785     3719654
ip(0)      10.1.1.2            0  10.0.1.2              0      4530     3518769
udp(17)    10.1.1.2            0  10.0.7.1              0      5011     3916767
tcp(6)     10.1.1.2           20  10.3.0.1             20         1        1494
tcp(6)     10.1.1.2           20  10.168.80.1          20         1         677
tcp(6)     10.1.1.2           20  10.69.192.1          20         1         446
tcp(6)     10.1.1.2           20  10.239.240.1         20         1        1426
tcp(6)     10.1.1.2           20  10.126.160.1         20         1         889
tcp(6)     10.1.1.2           20  10.71.224.1          20         1        1046

user@router1>  show services accounting memory
Service Accounting interface: sp-2/0/0, Local interface index: 468
Service name: (default sampling)
  Memory utilization
    Allocation count: 437340, Free count: 430681, Maximum allocated: 6782
    Allocations per second: 3366, Frees per second: 6412
    Total memory used (in bytes): 133416928, Total memory free (in bytes): 133961744

user@router1>  show services accounting packet-size-distribution
Service Accounting interface: sp-2/0/0, Local interface index: 468
Service name: (default sampling)
Range start     Range end     Number of packets     Percentage packets
         64            96               1705156                    100

user@router1>  show services accounting status
Service Accounting interface: sp-2/0/0, Local interface index: 468
Service name: (default sampling)
  Interface state: Monitoring
  Group index: 0
  Export interval: 60 secs, Export format: cflowd v5
  Protocol: IPv4, Engine type: 55, Engine ID: 5
  Route record count: 13, IFL to SNMP index count: 30, AS count: 1
  Time set: Yes, Configuration set: Yes
  Route record set: Yes, IFL SNMP map set: Yes

user@router1>  show services accounting usage
Service Accounting interface: sp-2/0/0, Local interface index: 468
Service name: (default sampling)
  CPU utilization
    Uptime: 4790345 milliseconds, Interrupt time: 1668537848 microseconds
    Load (5 second): 71%, Load (1 minute): 63%