예: MX 시리즈 라우터에 대한 샘플링 구성
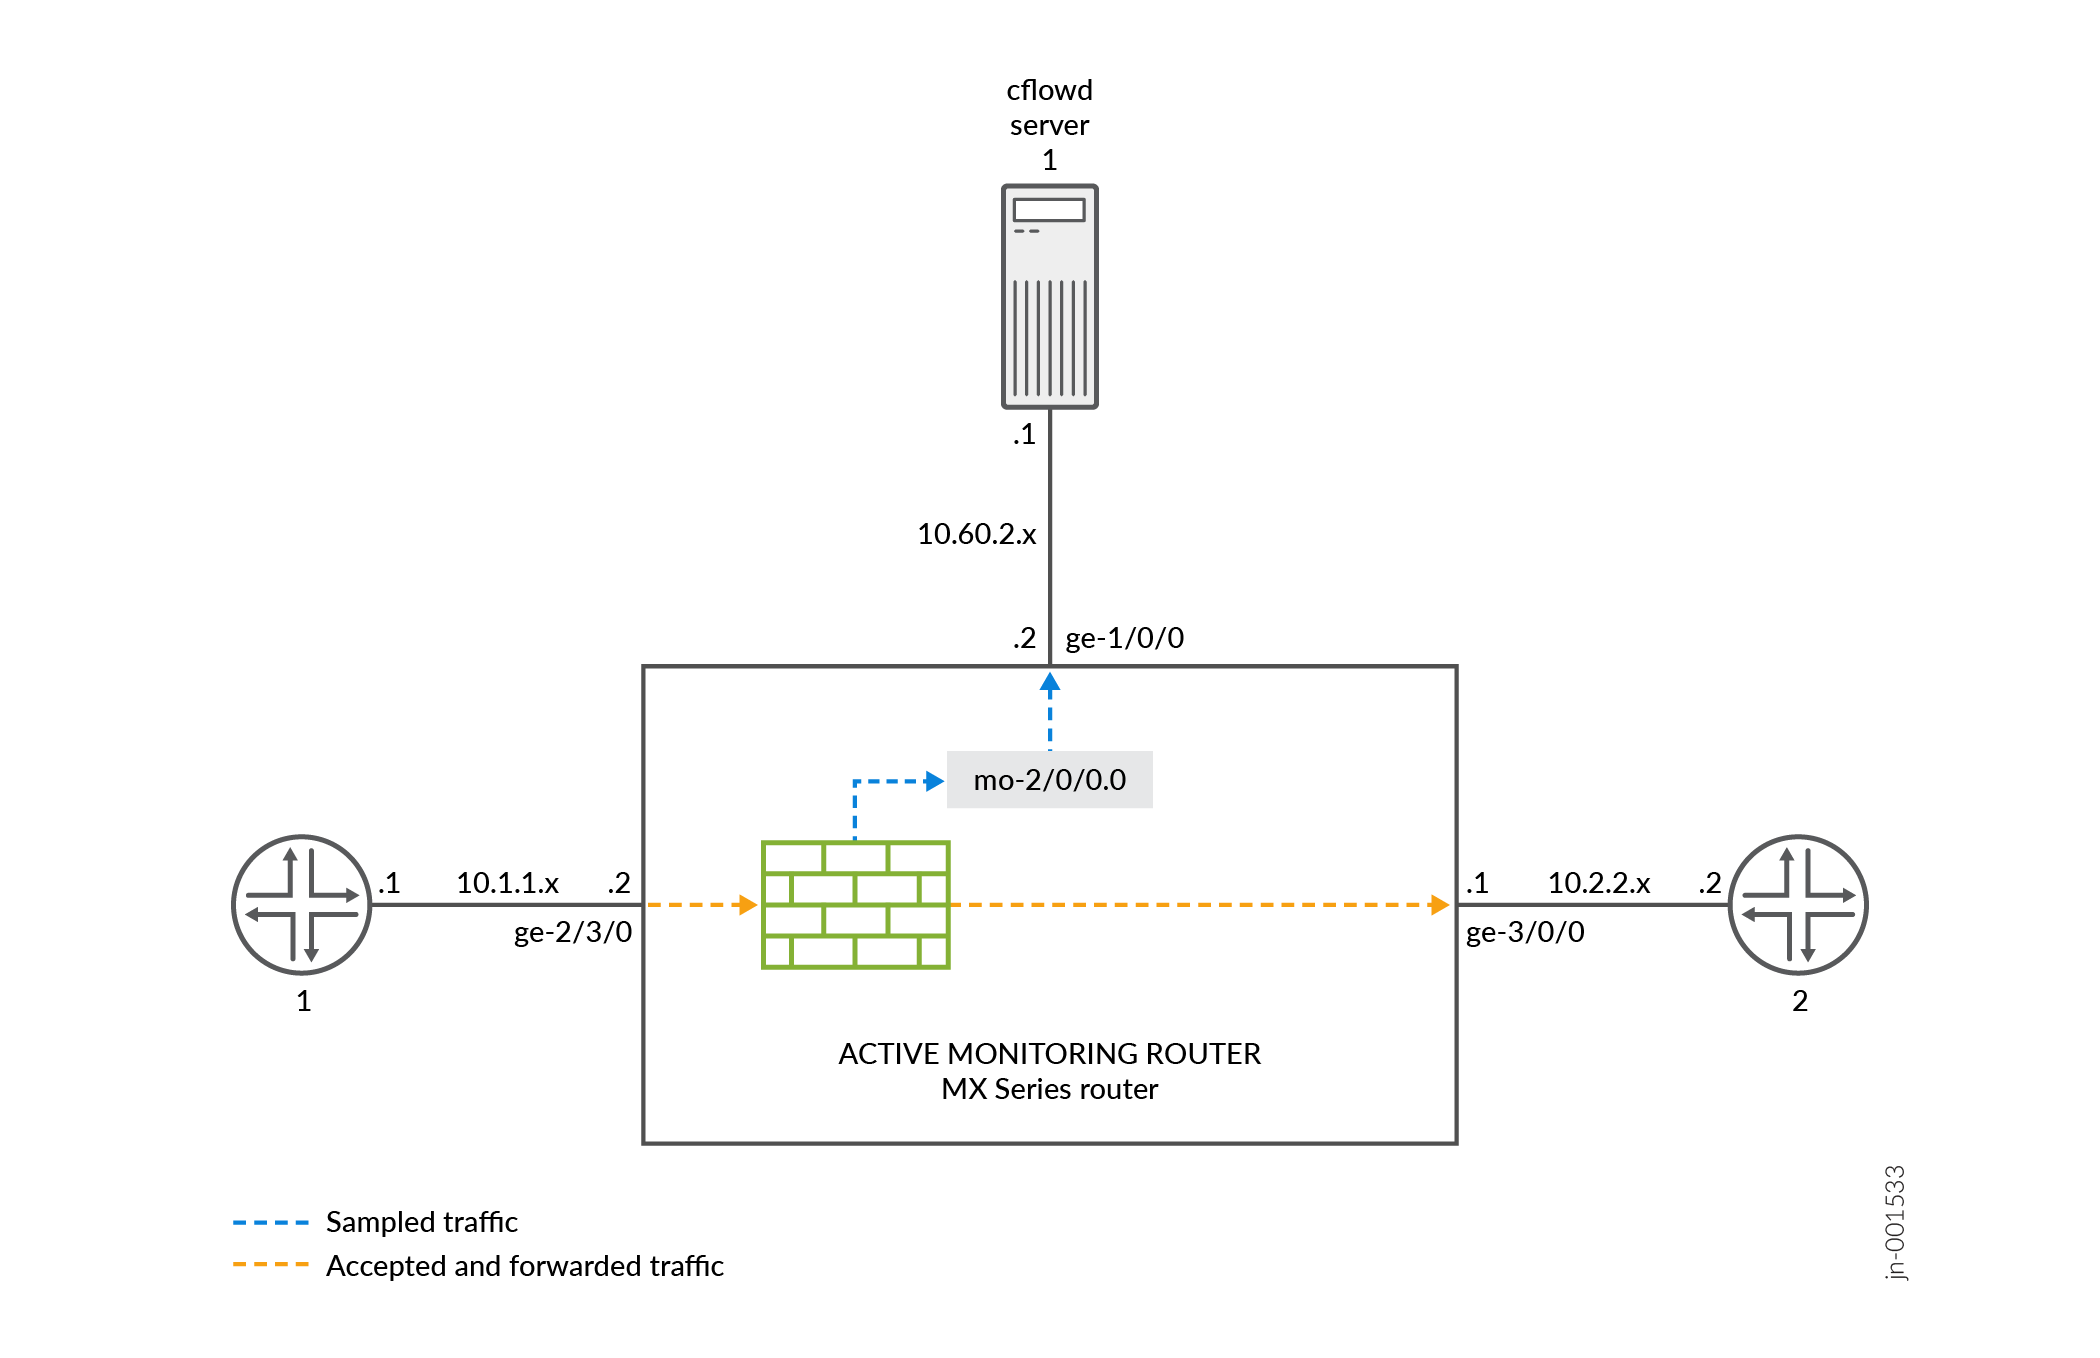
그림 1에서 라우터 1의 트래픽은 모니터링 라우터의 기가비트 이더넷 ge-2/3/0 인터페이스에 도착합니다. 대상 라우터 2로 연결되는 모니터링 라우터의 exit 인터페이스는 ge-3/0/0입니다. 액티브 플로우 모니터링에서 입력 인터페이스와 종료 인터페이스는 모두 모든 인터페이스 유형(예: 기가비트 이더넷)이 될 수 있습니다. 플로우 서버로 연결되는 내보내기 인터페이스는 ge-1/0/0입니다.
모든 트래픽을 샘플링, 카운트 및 수락하도록 방화벽 필터를 구성합니다. 입력 인터페이스에 필터를 적용하고 exit 인터페이스(트래픽 포워딩용), 적응형 서비스 인터페이스(플로우 처리용) 및 내보내기 인터페이스(플로우 레코드 내보내기용)를 구성합니다.
계층 수준에서 샘플링을 구성합니다.[edit forwarding-options] 문과 flow-server 함께 플로우 서버의 IP 주소와 포트를 포함하고, 계층 수준에서 [edit forwarding-options sampling] 문과 interface 함께 플로우 레코드 처리에 사용할 적응형 서비스 인터페이스를 지정합니다.
라우터 1
[edit]
interfaces {
   sp-2/0/0 { # This adaptive services interface creates the flow records.
        unit 0 {
            family inet {
                address 10.5.5.1/32 {
                    destination 10.5.5.2;
                }
            }
        }
    }
   ge-1/0/0 { # This is the interface where records are sent to the flow server.
        unit 0 {
            family inet {
                address 10.60.2.2/30;
            }
        }
    }
   ge-2/3/0 { # This is the input interface where all traffic enters the router.
        unit 0 {
            family inet {
                filter {
                   input catch_all; # This is where the firewall filter is applied.
                }
                address 10.1.1.1/20;
            }
        }
    }
   ge-3/0/0 { # This is the interface where the original traffic is forwarded.
        unit 0 {
            family inet {
                address 10.2.2.1/24;
            }
        }
    }
}
forwarding-options {
   sampling { # Traffic is sampled and sent to a flow server.
        input {
           rate 1; # Samples 1 out of x packets (here, a rate of 1 sample per packet).
        }
        family inet {
            output {
               flow-server 10.60.2.1 { # The IP address and port of the flow server.
                    port 2055;
                    version 5; # Records are sent to the flow server using version 5 format.
                }
                flow-inactive-timeout 15;
                flow-active-timeout 60;
                interface sp-2/0/0 { # Adding an interface here enables PIC-based sampling.
                    engine-id 5; # Engine statements are dynamic, but can be configured.
                    engine-type 55;
                    source-address 10.60.2.2; # You must configure this statement.
                }
            }
        }
    }
}
firewall {
    family inet {
        filter catch_all { # Apply this filter on the input interface.
            term default {
                then {
                    sample;
                    count counter1;
                    accept;
                }
            }
        }
    }
}
작업 확인
구성이 올바른지 확인하려면 액티브 플로우 모니터링을 위해 구성된 모니터링 스테이션에서 다음 명령을 사용하십시오.
show services accounting errorsshow services accounting (flow | flow-detail)show services accounting memoryshow services accounting packet-size-distributionshow services accounting statusshow services accounting usageshow services accounting aggregation template template-name name (detail | extensive | terse)(버전 9만 해당)
대부분의 액티브 플로우 모니터링 운영 모드 명령은 다음과 같은 패시브 플로우 모니터링 명령과 동일한 출력 정보를 포함합니다.
show services accounting errors =show passive-monitoring errorshow services accounting flow =show passive-monitoring flowshow services accounting memory =show passive-monitoring memoryshow services accounting status =show passive-monitoring statusshow services accounting usage = show passive-monitoring usage
활성 플로우 모니터링 명령은 샘플링, 폐기 회계, 포트 미러링 및 다중 포트 미러링을 포함한 대부분의 활성 플로우 모니터링 애플리케이션과 함께 사용할 수 있습니다. 그러나 패시브 플로우 모니터링 명령은 계층 수준에서 [edit forwarding-options monitoring] 모니터링 그룹을 포함하는 구성에만 사용할 수 있습니다.
다음은 구성 예제와 함께 사용되는 명령의 show 출력을 보여줍니다.
user@router1> show services accounting errors
Service Accounting interface: sp-2/0/0, Local interface index: 542
Service name: (default sampling)
  Error information
    Packets dropped (no memory): 0, Packets dropped (not IP): 0
    Packets dropped (not IPv4): 0, Packets dropped (header too small): 0
    Memory allocation failures: 0, Memory free failures: 0
    Memory free list failures: 0
    Memory overload: No, PPS overload: No, BPS overload: Yes

user@router1> show services accounting flow-detail limit 10
Service Accounting interface: sp-2/0/0, Local interface index: 468
Service name: (default sampling)
Protocol   Source         Source  Destination Destination    Packet        Byte
           Address          Port  Address            Port     count       count
udp(17)    10.1.1.2           53  10.0.0.1             53      4329     3386035
ip(0)      10.1.1.2            0  10.0.0.2              0      4785     3719654
ip(0)      10.1.1.2            0  10.0.1.2              0      4530     3518769
udp(17)    10.1.1.2            0  10.0.7.1              0      5011     3916767
tcp(6)     10.1.1.2           20  10.3.0.1             20         1        1494
tcp(6)     10.1.1.2           20  10.168.80.1          20         1         677
tcp(6)     10.1.1.2           20  10.69.192.1          20         1         446
tcp(6)     10.1.1.2           20  10.239.240.1         20         1        1426
tcp(6)     10.1.1.2           20  10.126.160.1         20         1         889
tcp(6)     10.1.1.2           20  10.71.224.1          20         1        1046

user@router1>  show services accounting memory
Service Accounting interface: sp-2/0/0, Local interface index: 468
Service name: (default sampling)
  Memory utilization
    Allocation count: 437340, Free count: 430681, Maximum allocated: 6782
    Allocations per second: 3366, Frees per second: 6412
    Total memory used (in bytes): 133416928, Total memory free (in bytes): 133961744

user@router1>  show services accounting packet-size-distribution
Service Accounting interface: sp-2/0/0, Local interface index: 468
Service name: (default sampling)
Range start     Range end     Number of packets     Percentage packets
         64            96               1705156                    100

user@router1>  show services accounting status
Service Accounting interface: sp-2/0/0, Local interface index: 468
Service name: (default sampling)
  Interface state: Monitoring
  Group index: 0
  Export interval: 60 secs, Export format: cflowd v5
  Protocol: IPv4, Engine type: 55, Engine ID: 5
  Route record count: 13, IFL to SNMP index count: 30, AS count: 1
  Time set: Yes, Configuration set: Yes
  Route record set: Yes, IFL SNMP map set: Yes

user@router1>  show services accounting usage
Service Accounting interface: sp-2/0/0, Local interface index: 468
Service name: (default sampling)
  CPU utilization
    Uptime: 4790345 milliseconds, Interrupt time: 1668537848 microseconds
    Load (5 second): 71%, Load (1 minute): 63%