
애플리케이션 인식 개요
Juniper Data Center Assurance의 애플리케이션 인식 기능은 특정 기간 동안 활성화된 서비스를 시각적으로 표시합니다. 또한 시각화는 이러한 서비스에서 데이터센터 패브릭을 어떻게 활용하고 있는지를 보여줍니다. 서비스를 선택하고 드릴다운하여 트래픽 흐름에 대한 자세한 정보를 얻을 수 있습니다.
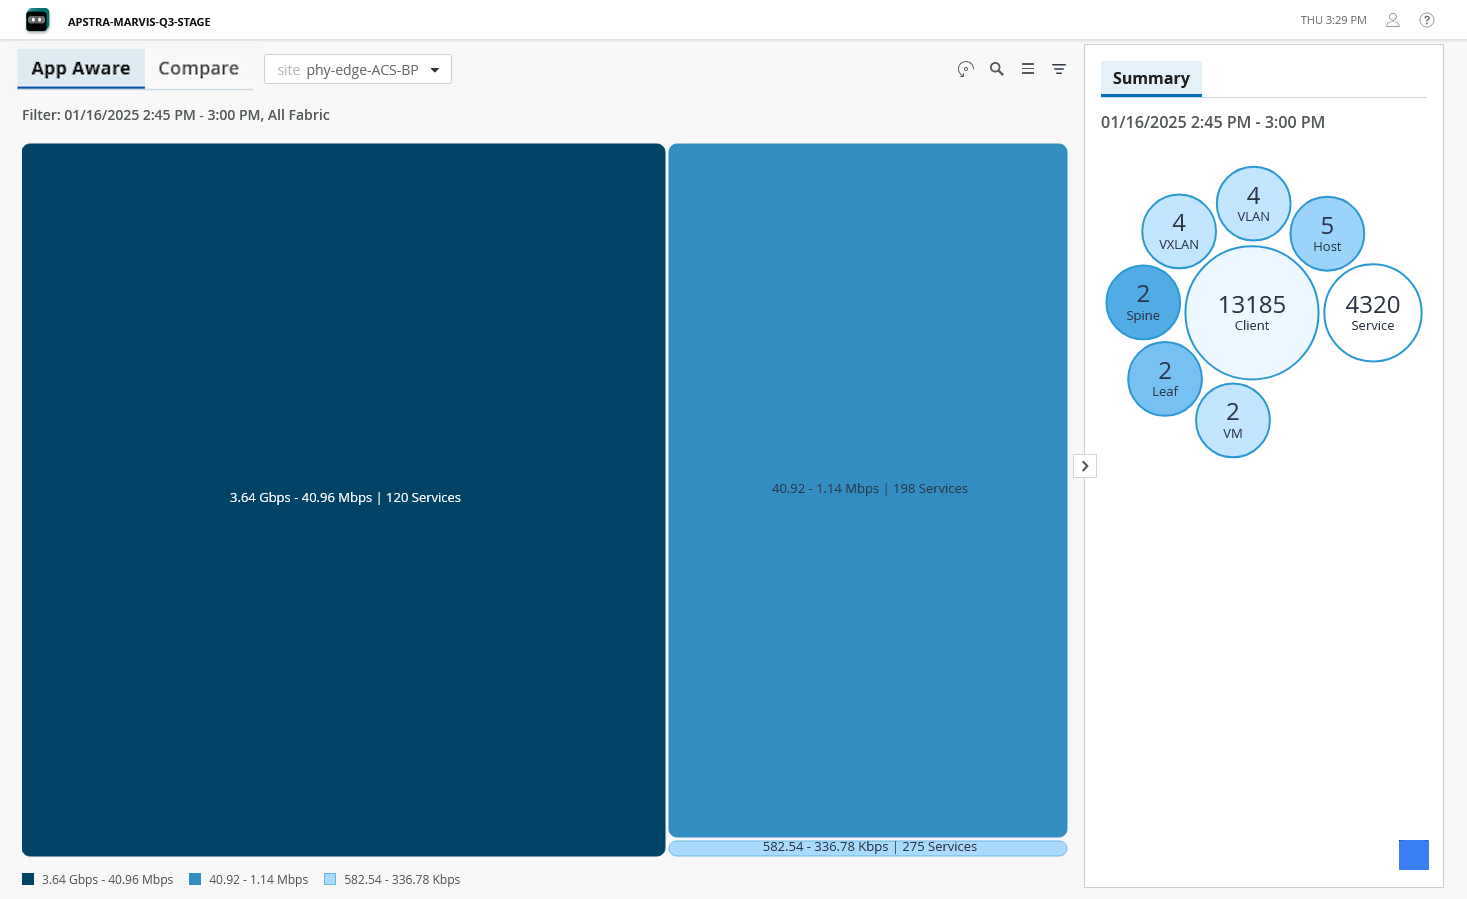
Apstra Data Center Director가 관리하는 데이터센터는 데이터센터에서 실행 중인 모든 서비스를 인식합니다. 애플리케이션 인식 기능은 사이트에서 실행 중인 모든 서비스를 선택한 사이트의 처리량, 볼륨 또는 연결별로 그룹화하여 시각적으로 표시합니다. 앱 인식 페이지에 표시되는 데이터는 15분마다 새로 고쳐집니다. 실시간 데이터를 보려면 페이지 오른쪽 상단의 온디맨드 데이터 버튼을 클릭합니다.
드릴다운하여 특정 서비스의 세부 정보를 보고, 네트워크 토폴로지를 보고, 이상이 있는 노드와 이상의 영향을 받는 디바이스에 연결된 호스트를 식별할 수 있습니다.
Juniper Data Center Assurance에서 플로우 데이터를 보려면 데이터센터의 디바이스에서 sFlow를 구성해야 합니다.
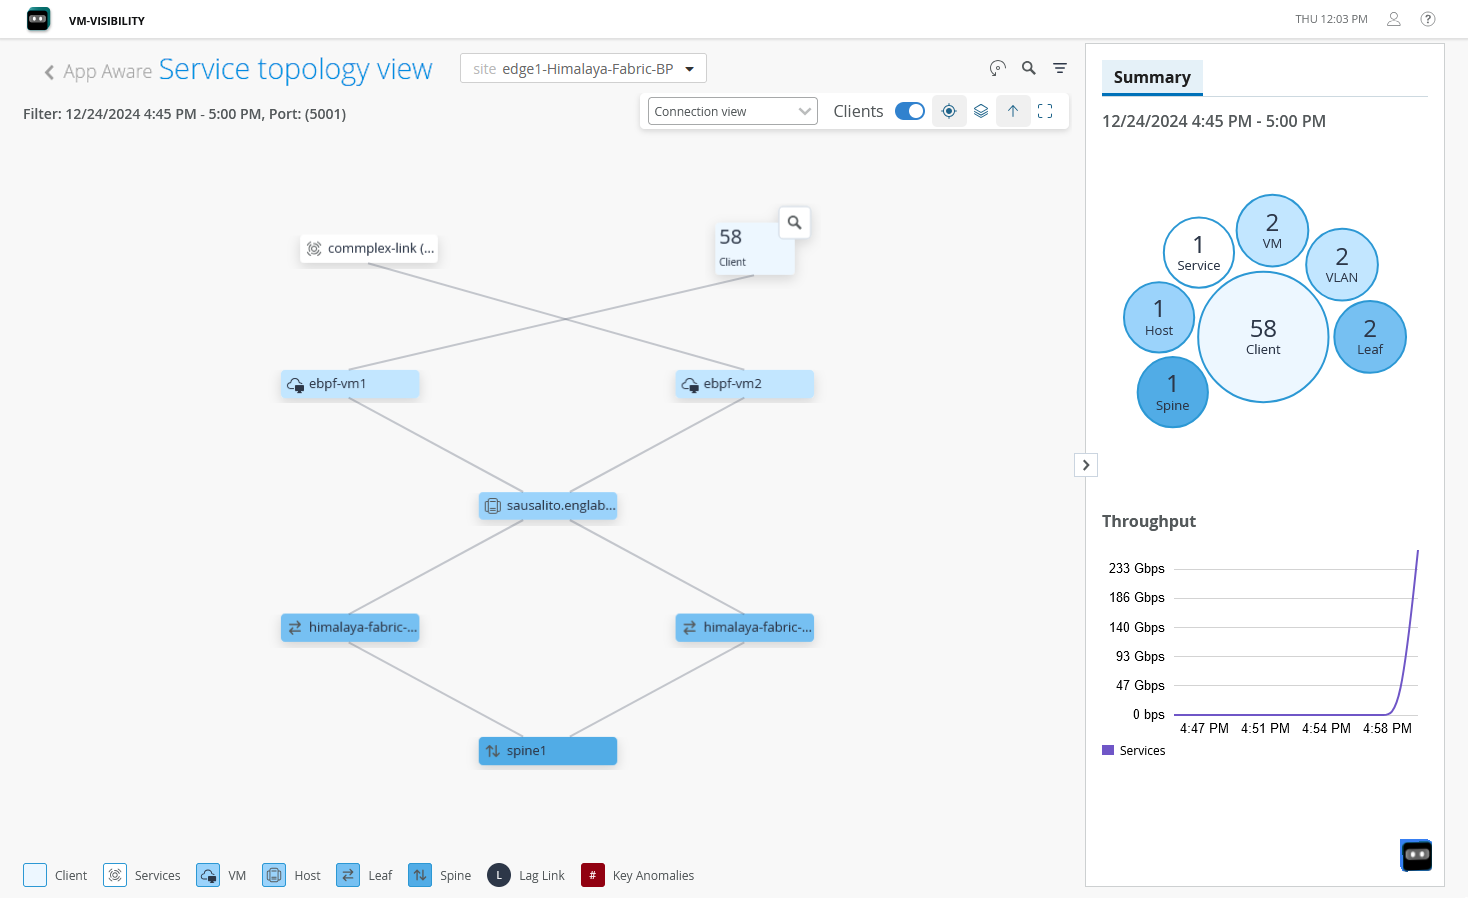
서비스 세트를 선택하고 노드가 호스트에 연결된 방식과 해당 서비스가 데이터센터 패브릭을 통과하는 방식을 검사할 수 있습니다. 노드에 영향을 미치는 이벤트 및 이상 징후의 총 수가 토폴로지 다이어그램에 표시됩니다.
In this demo, we'll show how the Juniper Data Center Assurance platform helps identify network issues when there's a service impact in the data center.
In our demo environment, we have a two-spine, two-leaf topology with multiple hosts connected to the leaf switches. These include both bare metal servers and ESXI hosts. Virtual machines running on the ESXI hosts are displayed at the top layer. For this demo, we'll simulate traffic between the two Ubuntu VMs, a server and a client. And the server will stream video using VLC. The client will access that stream. Then we'll introduce network congestion to see how Juniper Data Center Assurance detects and reports on the issue.
Here is our Ubuntu server VM where we have the VLC streaming server. The client VM is accessing that stream over port 8080 and we see that that stream is playing smoothly on the client.
In the App Aware page within Juniper Data Center Assurance, we can view traffic flows across the data center. Services are listed and organized by throughput. We can drill down and locate our video service running on port 8080. And when we click on it, we see the service topology showing the video service running the Ubuntu server VM, clients accessing the stream from the Ubuntu client VM, and the full network path through the spines and leaves.
And at this point, the data center health is normal and no anomalies are reported. So, at the moment our video is running smoothly and everything is fine. To simulate congestion, we switch to a test VM and start running high bandwidth iperf traffic between a test client and a server.
Before congestion, we see the video in the client playing smoothly. Once the test traffic begins, we observe the video slowing down and becoming glitchy.
This mirrors a real world situation where users may complain of video buffering or slow application performance. The root cause could be the server, the service, or as in this case, the network. Once we stop the test traffic, the video quickly returns to normal.
A few moments later, back in the Dashboard view, we see that an anomaly has been reported. A hot interface alert on one of the leaf switches. This was caused by the congestion. Clicking on this anomaly takes us to the Impact Analysis screen. There we can see the specific leaf affected, a list of services impacted by the anomaly. In our case, it shows two services - port 8080, our video stream, and the iperf traffic we generated caused the congestion. Apstra also lists the clients affected during that time frame, which was from 12:00 to 12:15 p.m.
If no one noticed the anomaly in real time, but a user later reports issues, for example, glitchy video around 12:00 p.m., we can still investigate. Using the Impact Analysis feature, we select a wider time range, say 11:15 a.m. to 12:45 p.m., and scroll through to the reported window.
Even though the anomaly is cleared, Apstra retains historical data. So, we can go back to 12:00 to 12:15 p.m., and we see the service impact, and we confirm that an anomaly was present and the video service on port 8080 was affected.
This demo illustrates how Juniper Data Center Assurance can help identify and trace network-related service impacts like video jitter caused by congestion. Even if the issue is temporary, the platform's impact analysis and anomaly history allow admins to go back, correlate user complaints with actual events, and resolve the root cause efficiently.
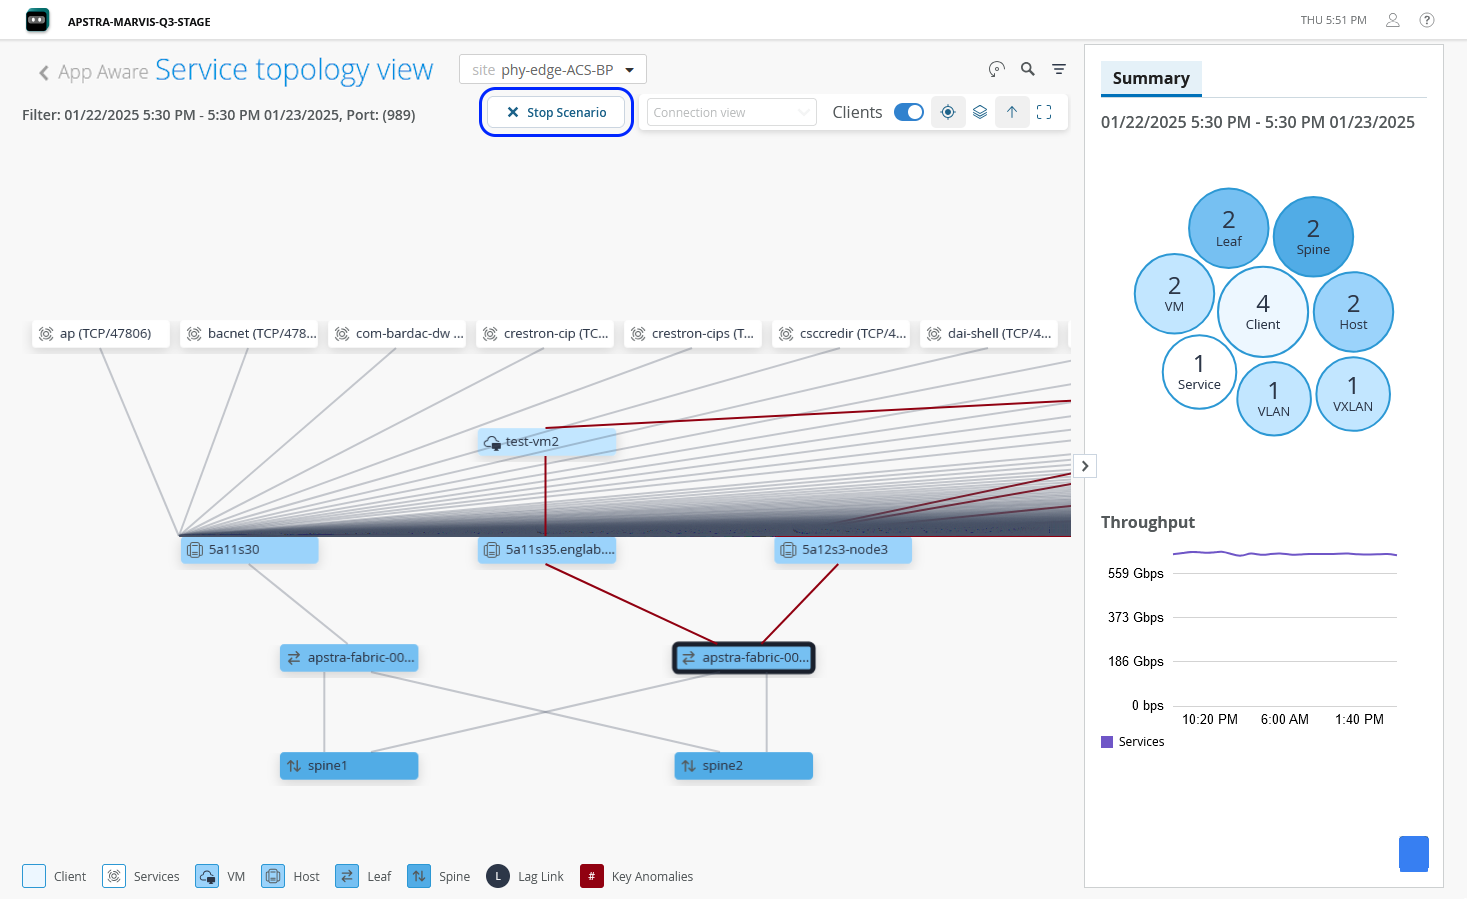
디바이스 또는 서비스 장애가 연결된 클라이언트에 미치는 영향을 시각적으로 볼 수 있습니다. 디바이스 또는 서비스를 선택하고 오른쪽 창에서 Fail Scenario (실패 시나리오)를 클릭합니다. 잠재적인 장애 시나리오가 시뮬레이션되어 토폴로지에 표시됩니다.
또한 특정 서비스에 대해 데이터센터 네트워크를 통해 트래픽이 어떻게 흐르는지 볼 수도 있습니다. 토폴로지에서 서비스를 선택하고 오른쪽 창에서 트래픽 플로우 를 클릭합니다. 드롭다운에서 모니터링할 클라이언트를 선택하면 애플리케이션 트래픽 흐름의 시각화를 볼 수 있습니다.
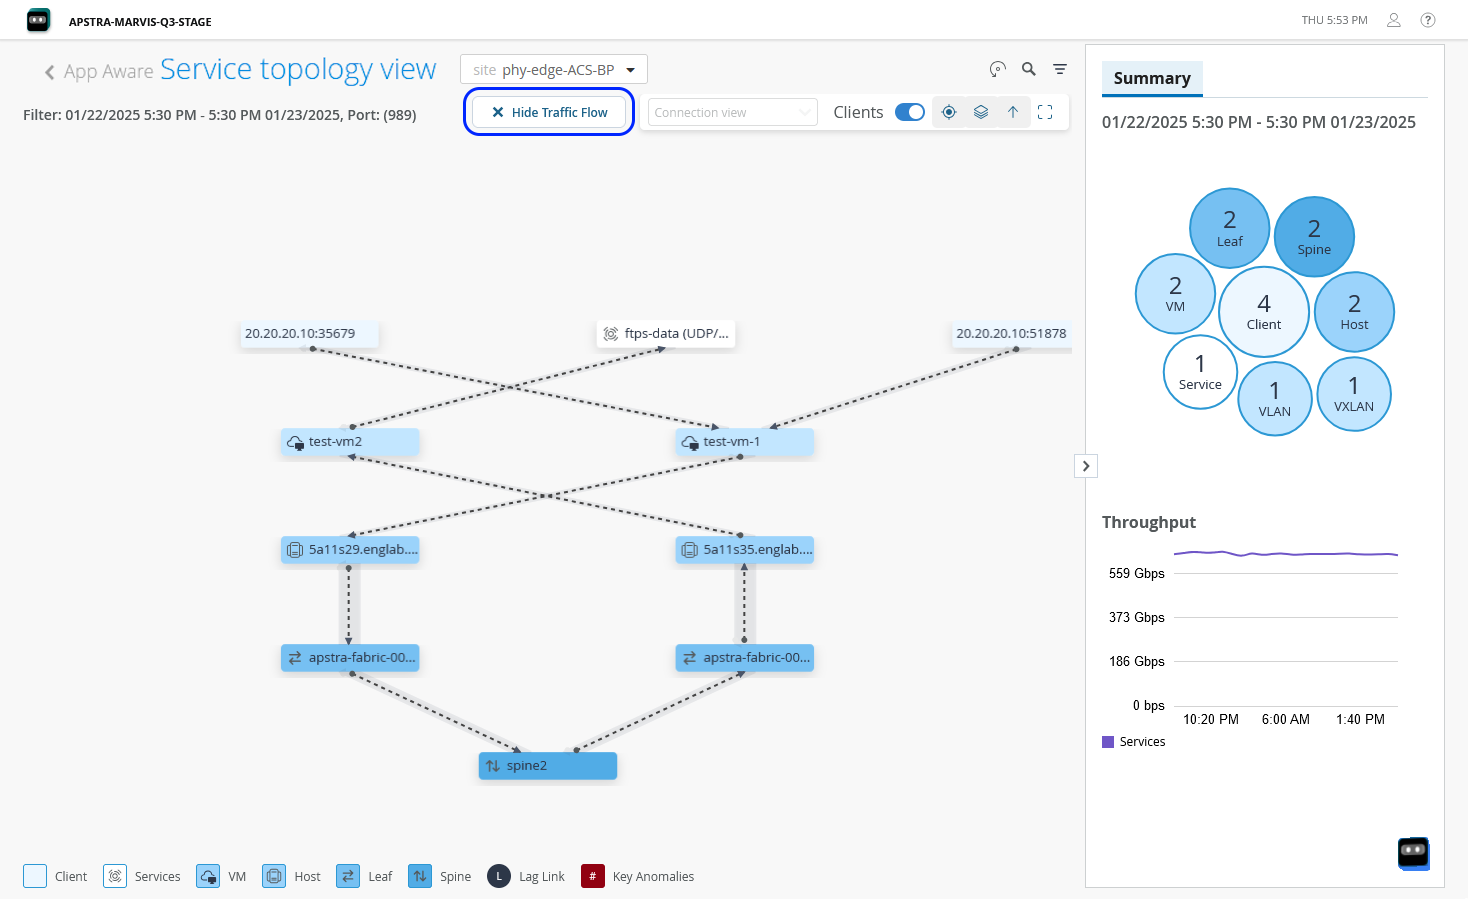
오른쪽 창의 요약 탭은 서비스와 연결된 디바이스 수 및 총 서비스 수와 같은 세부 정보와 함께 선택한 서비스의 요약을 제공합니다.
앱 인식 페이지의 검색 옵션을 사용하면 토폴로지 보기에서 드릴다운하지 않고도 필요한 서비스를 검사할 수 있습니다. 서비스를 직접 검색하고 해당 서비스에 대한 연결 및 플로우 세부 정보를 볼 수 있습니다. 필터 옵션을 사용하면 특정 리프와 스파스파인 노드 간의 연결을 살펴보고 보려는 특정 서비스와 계층을 선택하여 서비스 트래픽을 검사할 수 있습니다.
비교 탭에서 두 기간 동안 서비스와 엔드포인트가 어떻게 수행되었는지 비교할 수도 있습니다. Apstra 인스턴스에서 수집된 플로우 데이터는 Juniper Data Center Assurance에 30일 동안 저장됩니다. 서비스의 현재 성능을 지난 30일의 플로우 데이터와 비교할 수 있습니다. 연결 보기를 선택하여 디바이스와 연결된 서비스 간의 연결을 봅니다. 플로우 보기를 선택하여 서비스 트래픽이 네트워크를 활용하는 방식을 파악합니다.
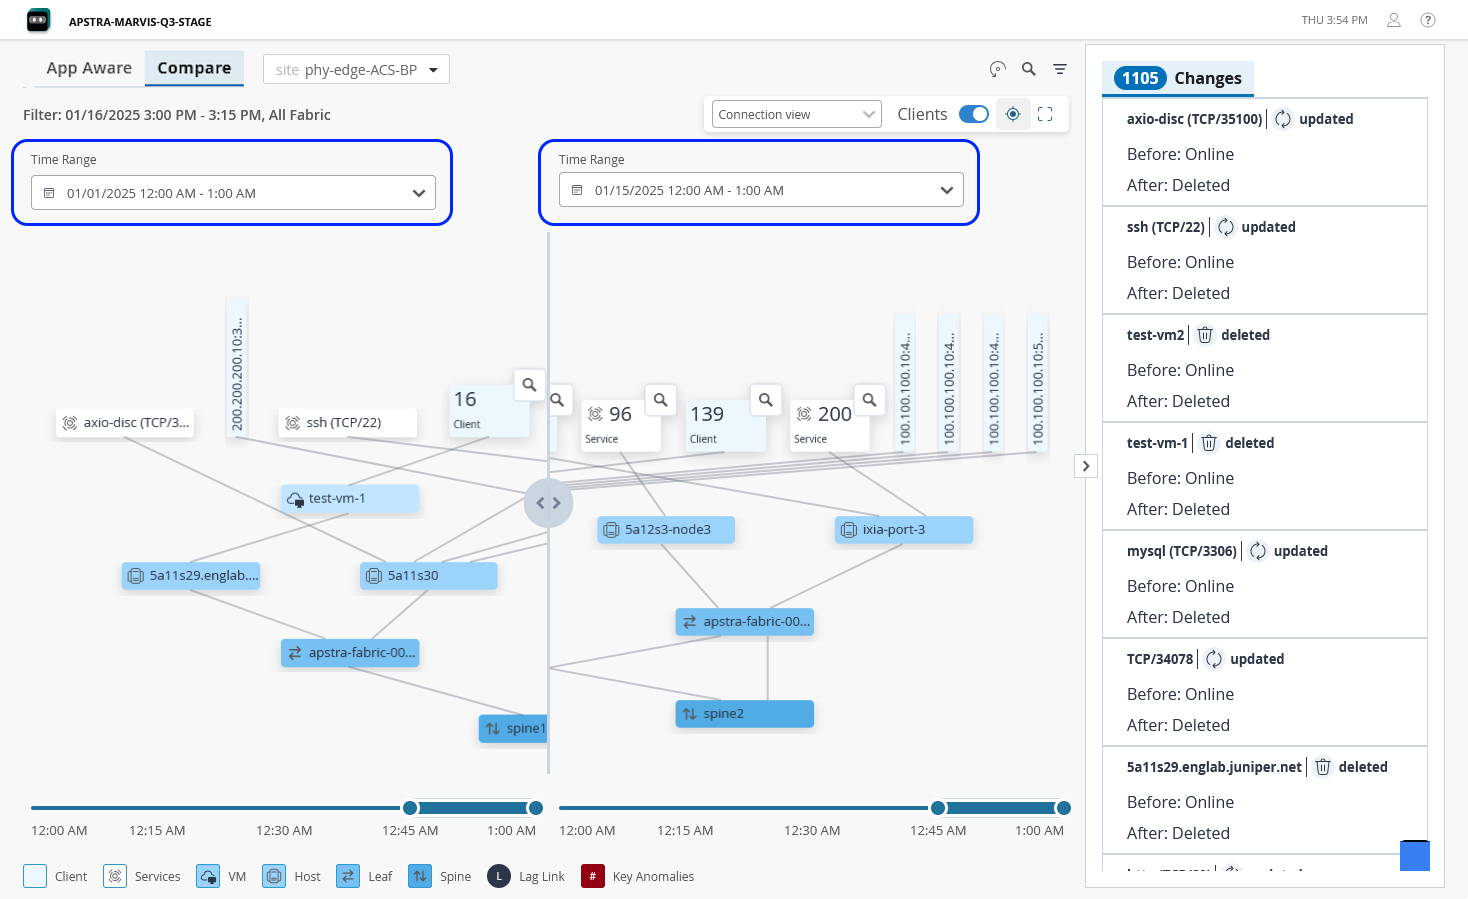 비교
비교
앱 인식 페이지의 플로우 보기는 노드 간의 플로우 데이터에 대한 정보를 제공합니다. 디바이스를 연결하는 선이 너무 두꺼울수록 해당 디바이스 간에 더 많은 트래픽이 교환되고 있음을 나타냅니다.
따라서 애플리케이션 인식 기능은 데이터센터에 대한 전체적인 보기를 제공하여 데이터센터 네트워크의 잠재적인 문제와 그것이 서비스에 미치는 영향에 대한 통찰력을 제공합니다.
App Aware의 이점
-
서비스-데이터센터 리소스 매핑을 제공하여 서비스가 데이터센터 패브릭을 어떻게 활용하는지에 대한 가시성을 제공합니다. 이러한 가시성을 통해 관리자는 애플리케이션 문제와 데이터센터 장치의 잠재적 네트워크 문제를 상호 연관시켜 문제를 더 빠르게 해결할 수 있습니다.
-
특정 서비스와 관련된 디바이스 또는 포트에 대한 정보를 제공합니다. 이를 통해 관리자는 영향 분석을 수행하고 문제를 일으키는 장치 또는 포트를 정확히 찾아낼 수 있습니다.
-
서비스가 다른 엔드포인트에 연결되는 방법을 표시하는 네트워크 토폴로지의 시각화를 제공합니다.
-
서비스 및 네트워크 엔드포인트의 트래픽 패턴과 성능 메트릭에 대한 인사이트를 제공합니다.