네트워크 토폴로지 보기
Contrail Networking 릴리스 1907부터 Contrail Command UI는 네트워크 토폴로지를 시각적으로 표현합니다. 패브릭 내의 모든 디바이스가 단일 보기에 표시됩니다.
토폴로지 보기는 Contrail Insights(이전의 AppFormix) 버전 2.19.11 이상에서 지원됩니다.
토폴로지 보기는 다양한 레이아웃 시각화 외에도 노드 끌기, 확대/축소, 뷰에 맞춤과 같은 기본 조작을 지원합니다. 사용자가 편집한 네트워크 레이아웃은 데이터베이스에 저장되므로 네트워크 장치 레이아웃의 모든 변경 사항이 세션 간에 유지됩니다.
토폴로지 보기에는 다음이 표시됩니다.
-
네트워크 장치
-
호스트
-
호스트의 컴퓨트 인스턴스
-
네트워크 디바이스와 Contrail Networking 호스트를 연결하는 Edge이지만 베어메탈 서버(BMS)만 연결하는 것은 아닙니다.
다음과 같은 세 가지 보기가 지원됩니다.
-
가로
-
세로
-
방사형
토폴로지 히트맵은 실시간 또는 이력으로 사용된 네트워크 및 서버 리소스를 보여줍니다. 예를 들어 데이터 센터 운영자는 초당 바이트 수, 네트워크 내부의 링크 사용률 또는 특정 서버나 가상 머신에서 사용 중인 CPU 리소스를 볼 수 있습니다.
Infrastructure > Fabrics > <fabric name> > 토폴로지 보기를 선택합니다. 표시 드롭다운 목록에서 조회한 데이터를 필터링하는 옵션을 선택합니다. 자세한 내용을 보려면 토폴로지 보기의 노드와 인터페이스 위로 마우스를 가져갑니다.
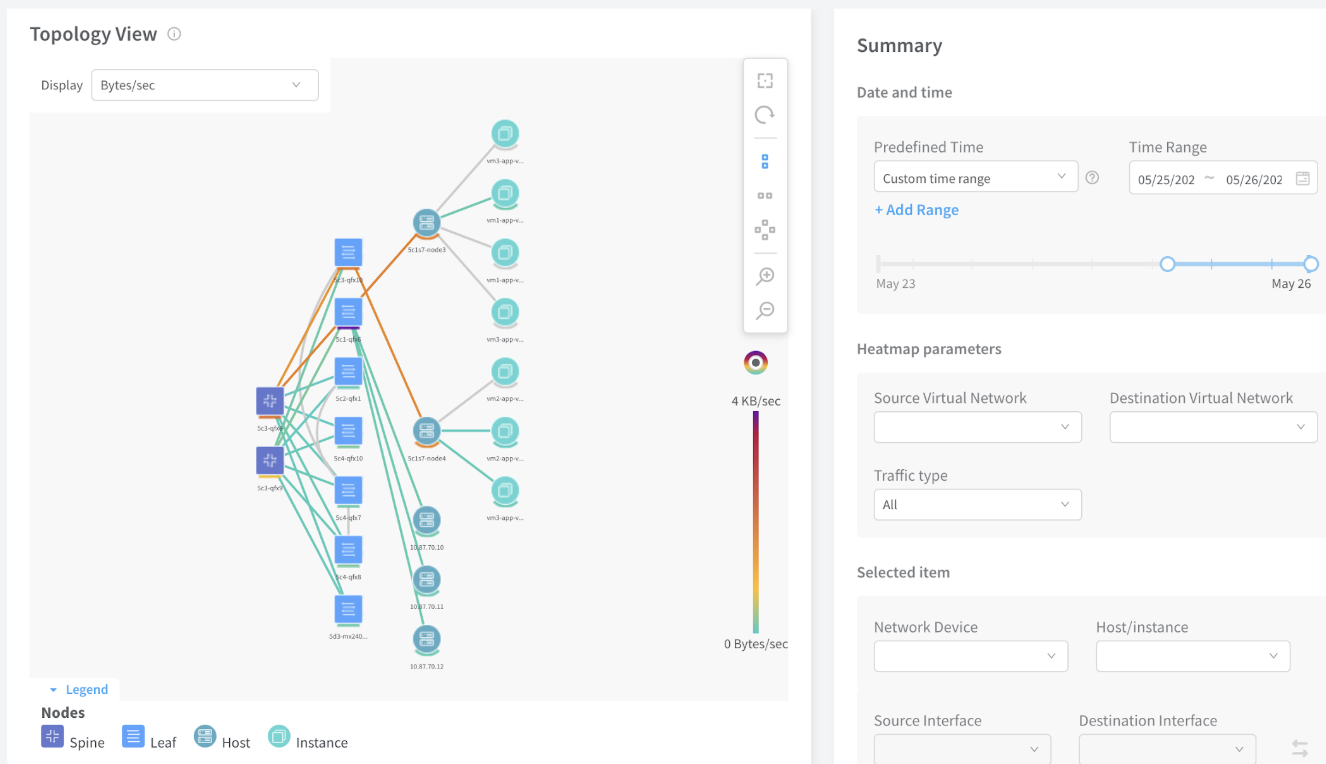
보기를 변경하려면 [토폴로지 보기] 패널의 세로 도구 모음에서 아이콘을 선택합니다. 다음은 예제 보기입니다. 요약 보기 옵션에 대한 설명은 표 1을 참조하십시오.
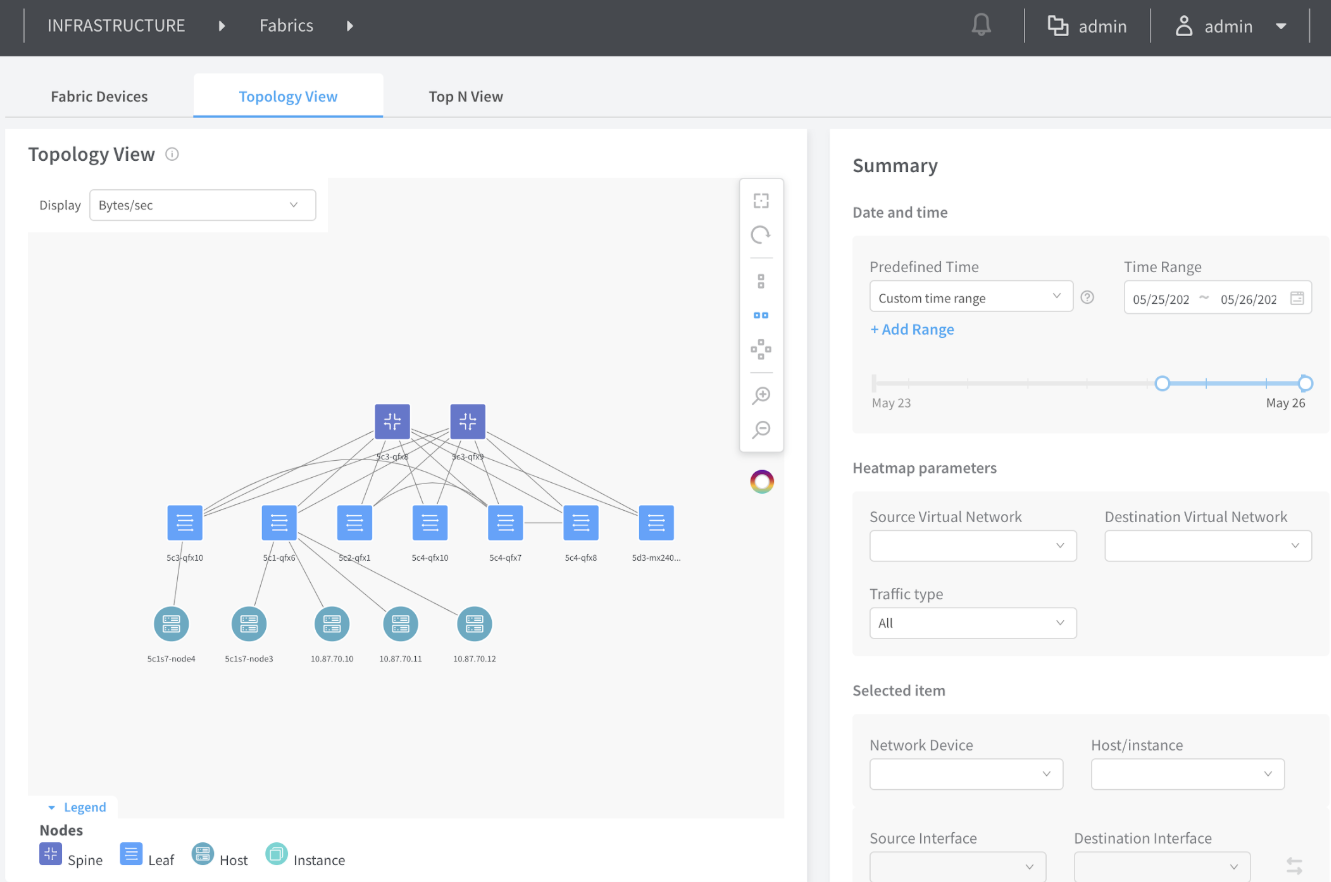
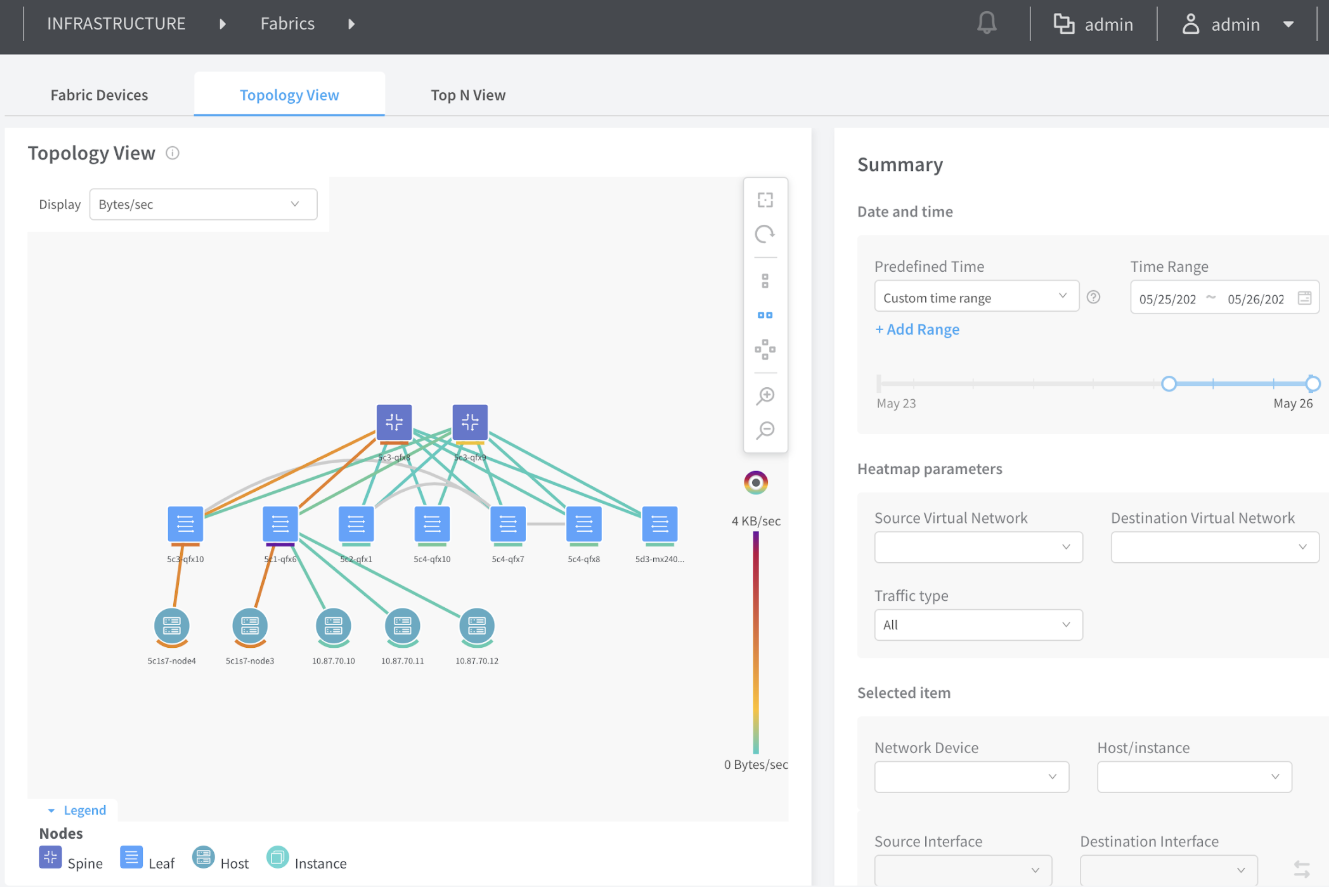 이 있는 수평 보기
 이 있는 수평 보기
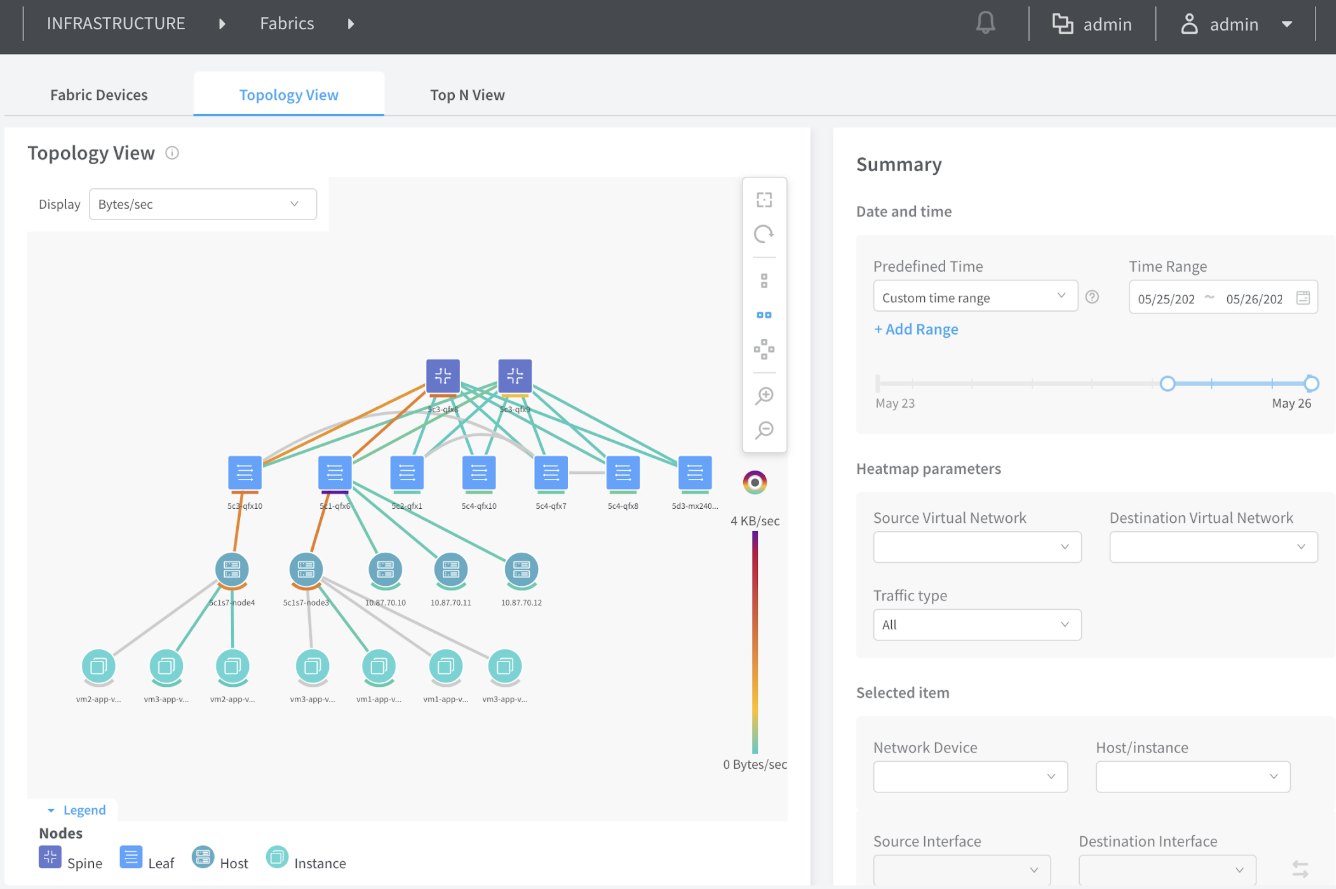
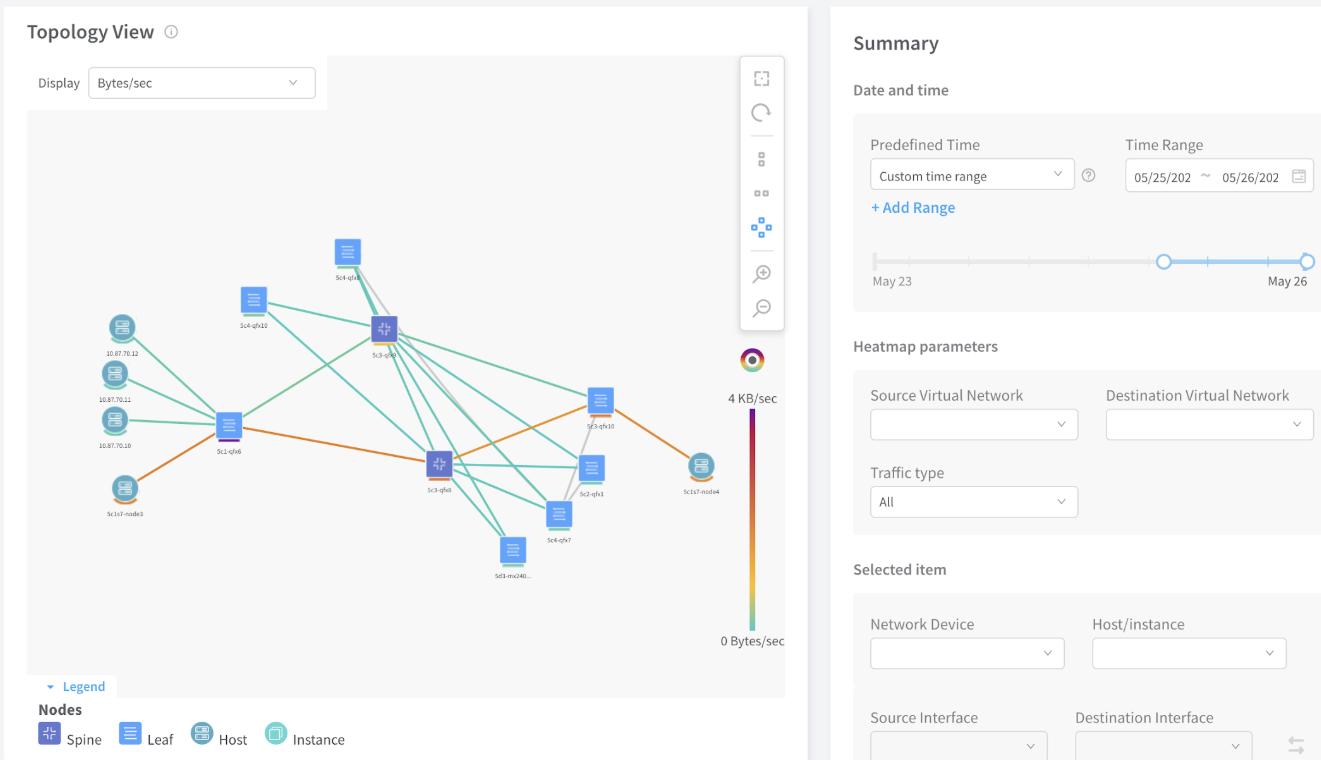
 이 있는 세로 보기
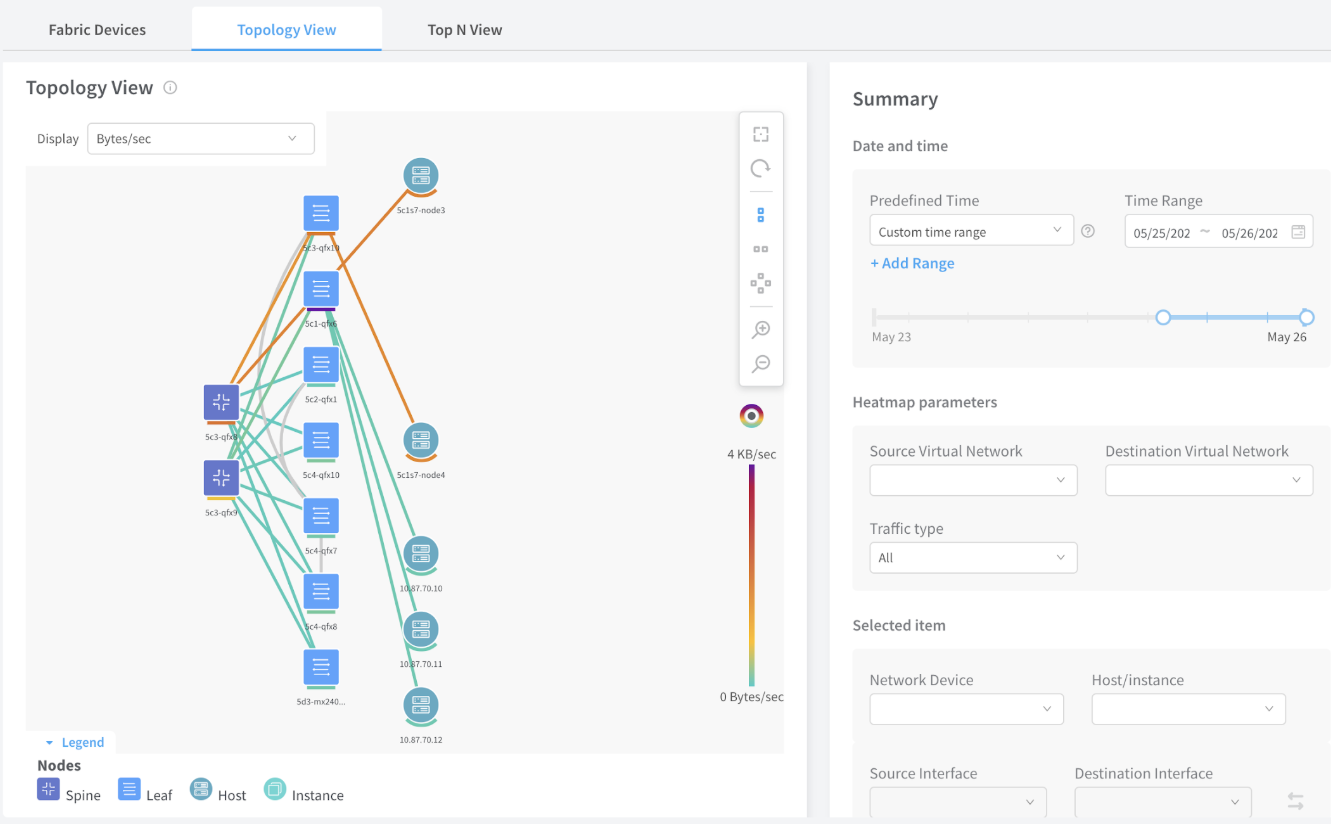
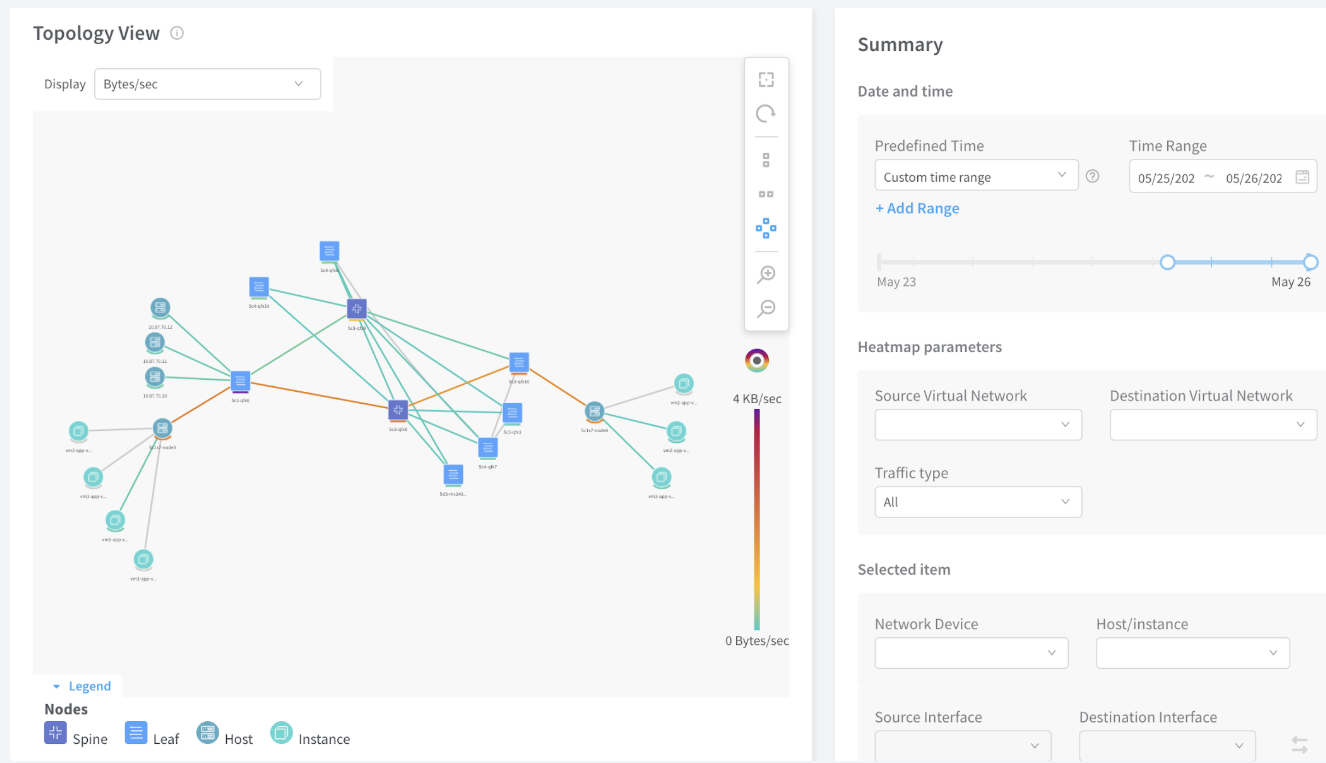 사용하는 방사형 보기
| Summary Options(요약 옵션) |
묘사 |
|---|---|
| 날짜 및 시간 |
|
| 사전 정의된 시간 |
기록에서 데이터를 표시할 기간을 선택합니다. |
| 시간 범위 |
달력을 사용하거나 필드에 직접 입력하여 원하는 시작 및 종료 시간을 선택합니다. 또한 마우스를 끌어 시간 간격을 선택할 수 있습니다. |
| 히트맵 매개 변수 |
|
| 원본 Virtual Network |
이 원본 가상 네트워크를 사용하여 데이터를 필터링합니다. |
| 대상 가상 네트워크 |
이 대상 가상 네트워크를 사용하여 데이터를 필터링합니다. |
| 트래픽 유형 |
모두, 멀티캐스트 또는 기타와 같은 트래픽 유형별로 데이터를 필터링합니다. |
| 선택 항목 |
|
| 네트워크 디바이스 |
네트워크 디바이스를 통과하는 데이터를 필터링합니다. |
| 호스트/인스턴스 |
호스트 컴퓨팅 인스턴스(예: 메모리 사용량 또는 CPU 사용량)를 사용하여 데이터를 필터링합니다. |
| 소스 인터페이스 |
선택한 네트워크 디바이스에서 소스 인터페이스를 필터링합니다. |
| 대상 인터페이스 |
선택한 네트워크 디바이스에서 대상 인터페이스를 필터링합니다 |
변경 내역 표
기능 지원은 사용 중인 플랫폼과 릴리스에 따라 결정됩니다. 기능 탐색기 를 사용하여 플랫폼에서 기능이 지원되는지 확인하세요.