例:M、MX、および T Series ルーターでのパッシブ フロー監視設定
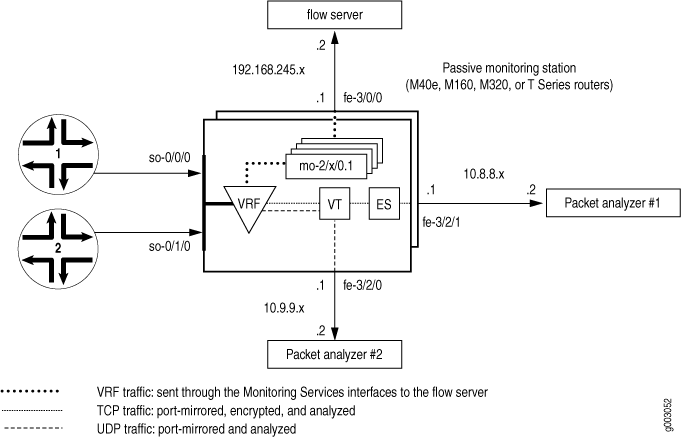
図 1 では、トラフィックはインターフェイス so-0/0/0 および so-0/1/0 を介して監視ステーションに入ります。ファイアウォール フィルターが監視対象のトラフィックを受け入れた後、パケットは VRF インスタンスに入ります。
元のパケットは、フロー処理のためにVRFインスタンス内で監視サービスPICに移動します。最終フロー パケットは、監視サービス インターフェイスから fe-3/0/0 インターフェイスからフロー サーバーに送信されます。
受け入れられたトラフィックのコピーは、トンネルPICにポートミラーリングされます。コピーされたパケットがトンネルインターフェイスに入ると、2つ目のファイアウォールフィルターがTCPパケットとUDPパケットを分離し、2つのフィルターベースの転送インスタンスに配置します。UDP インスタンスは、 fe-3/2/0 にアタッチされたパケットアナライザに UDP パケットを送信します。TCP インスタンスは暗号化のために TCP パケットを ES PIC に送信し、ES PIC は パケットを fe-3/2/1 に接続された 2 番目のパケットアナライザに送信します。
最初のステップは、監視するパケットを選択するファイアウォールフィルターを定義することです。フィルタリングされたすべてのトラフィックが受け入れられる必要があり、[edit firewall family inet filter filter-name term term-name then]階層レベルのport-mirrorステートメントは、ポートミラーリングを促進します。
次に、入力SONET/SDHインターフェイスを設定し、定義したファイアウォールフィルターを適用します。 passive-monitor-mode ステートメントは、SONET/SDH インターフェイスでの SONET キープアライブを無効にし、パッシブ フロー監視を有効にします。
監視サービスインターフェイス、エクスポートインターフェイス、トンネルインターフェイス、ESインターフェイスなど、監視アプリケーションで使用する他のすべてのインターフェイスを設定します。インターフェイスを設置したら、VRF インスタンスと監視グループを設定して、元のパケットを入力インターフェイスから監視サービス インターフェイスに転送して処理します。結果として得られるフロー記述パケットは 、fe-3/0/0 を出てフロー サーバーに到達します。
次に、監視対象トラフィックをトンネルインターフェイスにポートミラーリングするステートメントを設定します。このコピーされたトラフィックの一部をさらに分析するために選択し、一部のトラフィックを破棄するファイアウォールフィルターを設計します。この場合、TCP トラフィックと UDP トラフィックを分離し、これら 2 つのフローを別々のフィルターベースの転送ルーティング インスタンスに誘導します。UDPトラフィックからTCPトラフィックを分離できるように、必ずトンネルインターフェイスにフィルターを適用してください。また、ルーティングテーブルグループを使用して、転送インスタンスにインターフェイスルートをインポートします。
フィルターベースの転送インスタンスで、静的ルートのネクストホップを定義します。TCP インスタンスのネクスト ホップは ES インターフェイスで、UDP インスタンスのネクスト ホップは fe-3/2/0 に接続されたパケットアナライザです。最後に、TCP トラフィックのネクスト ホップが fe-3/2/1 に接続された 2 番目のパケットアナライザになるように IPSec を設定します。
[edit]
interfaces {
                   so-0/0/0 { # Traffic enters the router on this interface.
        description “ input interface”;
        encapsulation ppp;
        unit 0 {
                             passive-monitor-mode; # Disables SONET keepalives.
            family inet {
                filter {
                                         input input-monitoring-filter; # The firewall filter is applied here.
                }
            }
        }
    }
                   so-0/1/0 { # Traffic enters the router on this interface.
        description “ input interface”;
        encapsulation ppp;
        unit 0 {
                             passive-monitor-mode;  # Disables SONET keepalives.
            family inet {
                filter {
                                         input input-monitoring-filter;  # The firewall filter is applied here.
                }
            }
        }
    }
                   es-3/1/0 {  # This is where the TCP traffic enters the ES PIC.
        unit 0 {
            tunnel {
                source 10.8.8.1;
                destination 10.8.8.2;
            }
            family inet {
                ipsec-sa sa-esp;
                address 192.0.2.1/32 {
                    destination 192.0.2.2;
                }
            }
        }
    }
                   fe-3/0/0 { # Flow records exit here and travel to the flow server.
        description “ export interface to the flow server”;
        unit 0 {
            family inet;
            address 192.168.245.1/30;
        }
    }
                   fe-3/2/0 { # This export interface for UDP traffic leads to a packet analyzer.
        description “ export interface to the packet analyzer”;
        unit 0 {
            family inet {
                address 10.9.9.1/30;
            }
        }
    }
                   fe-3/2/1 {  # This IPSec tunnel source exports TCP traffic to a packet analyzer.
        unit 0 {
            family inet {
                address 10.8.8.1/30;
            }
        }
    }
                   mo-4/0/0 { # This marks the beginning of the monitoring services interfaces.
        unit 0 { # Unit 0 is part of the inet.0 routing table and generates flow records.
            family inet;
        }
                         unit 1 { # Unit 1 receives monitored traffic and is part of the VRF instance.
            family inet;
        }
    }
                   mo-4/1/0 {
        unit 0 { # Unit 0 is part of the inet.0 routing table and generates flow records.
            family inet;
        }
                         unit 1 { # Unit 1 receives monitored traffic and is part of the VRF instance.
            family inet;
        }
    }
                   mo-4/2/0 {
        unit 0 { # Unit 0 is part of the inet.0 routing table and generates flow records.
            family inet;
        }
                         unit 1 { # Unit 1 receives monitored traffic and is part of the VRF instance.
            family inet;
        }
    }
                   mo-4/3/0 {
        unit 0 { # Unit 0 is part of the inet.0 routing table and generates flow records.
            family inet;
        }
                         unit 1 { # Unit 1 receives monitored traffic and is part of the VRF instance.
            family inet;
        }
    }
                   vt-0/2/0 {  # The tunnel services interface receives the port-mirrored traffic.
        unit 0 {
            family inet {
                filter {
                                         input tunnel-interface-filter;  # The filter splits traffic into TCP and UDP
                }
            }
        }
    }
}
forwarding-options {
                   monitoring group1 {  # Monitored traffic is processed by the monitoring services
        family inet { # interfaces and flow records are sent to the flow server.
                               output {
                export-format cflowd-version-5;
                flow-active-timeout 60;
                flow-inactive-timeout 30;
                                   flow-server 192.168.245.2 port 2055; # IP address and port for server.
                                     interface mo-4/0/0.1 {  # Use monitoring services interfaces for output.
                    engine-id 1; # engine and interface-index statements are optional.
                    engine-type 1;
                    input-interface-index 44;
                    output-interface-index 54;
                                         source-address 192.168.245.1; # This is the IP address of fe-3/0/0.
                }
                interface mo-4/1/0.1 {
                    engine-id 2; # engine and interface-index statements are optional.
                    engine-type 1;
                    input-interface-index 45;
                    output-interface-index 55;
                    source-address 192.168.245.1; # This is the IP address of fe-3/0/0.
                }
                interface mo-4/2/0.1 {
                    engine-id 3; # engine and interface-index statements are optional.
                    engine-type 1;
                    input-interface-index 46;
                    output-interface-index 56;
                    source-address 192.168.245.1; # This is the IP address of fe-3/0/0.
                }
                interface mo-4/3/0.1 {
                    engine-id 4; # engine and interface-index statements are optional.
                    engine-type 1;
                    input-interface-index 47;
                    output-interface-index 57;
                                         source-address 192.168.245.1; # This is the IP address of fe-3/0/0.
                }
            }
        }
    }
                   port-mirroring {  # Copies the traffic and sends it to the Tunnel Services PIC.
        family inet {
            input {
                rate 1;
                run-length 1;
            }
            output {
                                   interface vt-0/2/0.0;
                no-filter-check;
            }
        }
    }
}
             routing-options { # This installs the interface routes into the forwarding instances.
                   interface-routes {

         rib-group inet bc-vrf;
    }
    rib-groups {

         bc-vrf {

         import-rib [inet.0 tcp-routing-table.inet.0 udp-routing-table.inet.0];
        }
    }
    forwarding-table {
        export pplb; # Applies per-packet load balancing to the forwarding table.
    }
}
policy-options {
    policy-statement monitoring-vrf-import {
        then reject;
    }
    policy-statement monitoring-vrf-export {
        then reject;
    }
    policy-statement pplb {
        then {
            load-balance per-packet;
        }
    }
}
             security { # This sets IPSec options for the ES PIC.
    ipsec {
        proposal esp-sha1-3des {
            protocol esp;
            authentication-algorithm hmac-sha1-96;
            encryption-algorithm 3des-cbc;
            lifetime-seconds 180;
        }
        policy esp-group2 {
            perfect-forward-secrecy {
                keys group2;
            }
            proposals esp-sha1-3des;
        }
        security-association sa-esp {
            mode tunnel;
            dynamic {
                ipsec-policy esp-group2;
            }
        }
    }
    ike {
        proposal ike-esp {
            authentication-method pre-shared-keys;
            dh-group group2;
            authentication-algorithm sha1;
            encryption-algorithm 3des-cbc;
            lifetime-seconds 180;
        }
        policy 10.8.8.2 {
            mode aggressive;
            proposals ike-esp;
            pre-shared-key ascii-text "$ABC123";
        }
    }
}
firewall {
    family inet {
        filter input-monitoring-filter { # This filter selects traffic to send into the VRF
            term 1 { # instance and prepares the traffic for port mirroring.
                from {
                    destination-address {
                        10.7.0.0/16;
                    }
                }
                then {
                    port-mirror;
                    accept;
                }
            }
            term 2 {
                from {
                    destination-address {
                        10.6.0.0/16;
                    }
                }
                then accept;
            }
        }
                         filter tunnel-interface-filter {  # This filter breaks the port-mirrored traffic into two
            term tcp { # filter-based forwarding instances: TCP packets and UDP packets.
                from {
                    protocol tcp;
                }
                then { # This counts TCP packets and sends them into a TCP instance.
                    count tcp;
                    routing-instance tcp-routing-table;
                }
            }
            term udp {
                from {
                    protocol udp;
                }
                then { # This counts UDP packets and sends them into a UDP instance.
                    count udp;
                    routing-instance udp-routing-table;
                }
            }
            term rest {
                then {
                    count rest;
                    discard;
                }
            }
        }
    }
}
routing-instances {
                   monitoring-vrf { # This is the VRF instance where you send the traffic. It contains
        instance-type vrf; # the input interface and the monitoring services interfaces.
                       interface so-0/0/0.0; # Traffic enters the router on these input interfaces.
        interface so-0/1/0.0;

         interface mo-4/0/0.1;

         interface mo-4/1/0.1; # These are output interfaces (use them as
        interface mo-4/2/0.1; # output interfaces in your monitoring group).
        interface mo-4/3/0.1;
        route-distinguisher 69:1;
        vrf-import monitoring-vrf-import;
        vrf-export monitoring-vrf-export;
        routing-options { # Sends traffic to a group of monitoring services interfaces.
            static {

         route 0.0.0.0/0 next-hop [mo-4/0/0.1 mo-4/1/0.1
mo-4/2/0.1 mo-4/3/0.1];
            }
        }
    }
                   tcp-routing-table {  # This is the filter-based forwarding instance for TCP traffic.
        instance-type forwarding;
                         routing-options {  # The next hop is the ES PIC.
            static {

         route 0.0.0.0/0 next-hop es-3/1/0.0;
            }
        }
    }
    udp-routing-table { # This is the filter-based forwarding instance for UDP traffic.
        instance-type forwarding;
        routing-options { # The next hop is the second packet analyzer.
            static {

         route 0.0.0.0/0 next-hop 10.9.1.2;
            }
        }
    }
}
機能の検証
設定が正しいことを確認するには、パッシブフロー監視用に設定された監視ステーションで次のコマンドを使用します。
-
show route 0/0 -
show passive-monitoring error -
show passive-monitoring flow -
show passive-monitoring memory -
show passive-monitoring status -
show passive-monitoring usage
show passive-monitoring error コマンドと show passive-monitoring flow コマンドの統計情報をクリアするには、clear passive-monitoring (all | interface-name) コマンドを発行します。
また、簡易ネットワーク管理プロトコル(SNMP)を使用して、パッシブフローの監視ステータスを表示することもできます。以下の管理情報ベース(MIB)テーブルがサポートされています。
-
jnxPMonErrorTable ー
show passive-monitoring errorコマンドに対応します。 -
jnxPMonFlowTable ー
show passive-monitoring flowコマンドに対応します。 -
jnxPMonMemoryTable ー
show passive-monitoring memoryコマンドに対応します。
次のセクションは、設定例で使用される show コマンドの出力を示しています。
user@host> show route 0/0
 <skip inet.0>
#ルーティングインスタンスルートにのみ関係します。
bc-vrf.inet.0:  1 destinations, 1 routes (1 active, 0 holddown, 0 hidden)
bc-vrf.inet.0:+ = Active Route, - = Last Active, * = Both
0.0.0.0/0          *[Static/5] 5d 17:34:57
                      via mo-4/0/0.1
                    > via mo-4/1/0.1
                      via mo-4/2/0.1
                      via mo-4/3/0.1
tcp-rt.inet.0: 13 destinations, 13 routes (12 active, 0 holddown, 1
hidden)
+ = Active Route, - = Last Active, * = Both
0.0.0.0/0          *[Static/5] 19:24:39
                    > via es-3/1/0.0
  : <other interface routes>
udp-rt.inet.0: 13 destinations, 13 routes (12 active, 0 holddown, 1
hidden)
+ = Active Route, - = Last Active, * = Both
0.0.0.0/0          *[Static/5] 19:24:39
                    > to 10.9.1.2 via fe-3/2/0.0
  : <other interface routes>
すべての show passive-monitoring コマンドについて、ワイルドカード(* など)または all オプションを使用した場合に得られる出力は、 [edit forwarding-options monitoring group-name] 階層レベルでリストされている設定済みインターフェイスに基づきます。設定例からの出力には、設定されたインターフェイス mo-4/0/0、 mo-4/1/0、 mo-4/2/0、および mo-4/3/0に関する情報のみが表示されます。
engine-idやengine-typeなど、監視グループで設定できるステートメントの多くは、show passive-monitoringコマンドの出力に表示されます。
| 畑 |
説明 |
|---|---|
| ドロップされたパケット数(メモリなし) |
- メモリが原因でドロップされたパケットの数。 |
| ドロップされたパケット(IP ではない) |
ドロップされた非 IP パケットの数。 |
| ドロップされたパケット数(IPv4 以外) |
IPv4 チェックに失敗したためにドロップされたパケットの数。 |
| ドロップされたパケット数(ヘッダーが小さすぎる) |
パケット長または IP ヘッダー長が小さすぎたためにドロップされたパケット数。 |
| メモリ割り当ての失敗 |
フロー レコードのメモリ割り当てエラーの数。この数字は、空きリストの補充に失敗したことを反映しています。数値が大きい場合は、監視ステーションのメモリ容量がほとんど不足していることを示します。 |
| メモリ解放の障害 |
フロー レコードのメモリ解放数。 |
| メモリ空きリストの失敗 |
失敗したフリーリストから受信したフローレコードの数。メモリがほとんど枯渇しているか、1秒間に作成される128Kを超える新しいフローが多すぎます。 |
| メモリに関する警告 |
フローが、モニタリング サービス PIC で 100 万パケット/秒(Mpps)または モニタリング サービス II PIC で 2 Mpps を超えました。応答は 「はい」 または 「いいえ」です。 |
| メモリ過負荷 |
メモリが過負荷になっています。応答は 「はい 」または 「いいえ」です。 |
| PPS過負荷 |
1秒あたりのパケット数で、PICが設定されたしきい値よりも多くのトラフィックを受信しているかどうか。応答は 「はい」 または 「いいえ」です。 |
| BPS過負荷 |
PICが設定されたしきい値よりも多くのトラフィックを受信しているかどうか(バイト/秒)。応答は 「はい」 または 「いいえ」です。 |
user@host> show passive-monitoring error all
Passive monitoring interface: mo-4/0/0, Local interface index: 44
  Error information
    Packets dropped (no memory): 0, Packets dropped (not IP): 0
    Packets dropped (not IPv4): 0, Packets dropped (header too small): 0
    Memory allocation failures: 0, Memory free failures: 0
    Memory free list failures: 0
    Memory warning: No, Memory overload: No, PPS overload: No, BPS overload: No

Passive monitoring interface: mo-4/1/0, Local interface index: 45
  Error information
    Packets dropped (no memory): 0, Packets dropped (not IP): 0
    Packets dropped (not IPv4): 0, Packets dropped (header too small): 0
    Memory allocation failures: 0, Memory free failures: 0
    Memory free list failures: 0
    Memory warning: No, Memory overload: No, PPS overload: No, BPS overload: No

Passive monitoring interface: mo-4/2/0, Local interface index: 46
  Error information
    Packets dropped (no memory): 0, Packets dropped (not IP): 0
    Packets dropped (not IPv4): 0, Packets dropped (header too small): 0
    Memory allocation failures: 0, Memory free failures: 0
    Memory free list failures: 0
    Memory warning: No, Memory overload: No, PPS overload: No, BPS overload: No

Passive monitoring interface: mo-4/3/0, Local interface index: 47
  Error information
    Packets dropped (no memory): 0, Packets dropped (not IP): 0
    Packets dropped (not IPv4): 0, Packets dropped (header too small): 0
    Memory allocation failures: 0, Memory free failures: 0
    Memory free list failures: 0
    Memory warning: No, Memory overload: No, PPS overload: No, BPS overload: No
| 畑 |
説明 |
|---|---|
| フロー パケット |
運用PICが受信したパケット数。 |
| フロー バイト |
動作PICが受信したバイト数。 |
| フロー パケット 10 秒レート |
PICによって処理され、10秒平均として表示される1秒あたりのパケット数。 |
| フロー バイト 10 秒レート |
PICによって処理され、10秒平均として表示される1秒あたりのバイト数。 |
| アクティブフロー |
PIC によって追跡された現在アクティブなフローの数。 |
| 合計フロー数 |
運用PICが受信したフローの総数。 |
| エクスポートされたフロー |
運用PICによってエクスポートされたフローの総数。 |
| エクスポートされたフロー パケット |
運用PICによってエクスポートされたフローパケットの総数。 |
| 非アクティブなフローがタイムアウトしました |
非アクティブのためにエクスポートされたフローの合計数。 |
| フロー アクティブがタイムアウトしました |
アクティブなタイムアウトのためにエクスポートされた、存続時間の長いフローの合計数。 |
user@host> show passive-monitoring flow all
Passive monitoring interface: mo-4/0/0, Local interface index: 44
  Flow information
    Flow packets: 6533434, Flow bytes: 653343400
    Flow packets 10-second rate: 0, Flow bytes 10-second rate: 0
    Active flows: 0, Total flows: 1599
    Flows exported: 1599, Flows packets exported: 55
    Flows inactive timed out: 1599, Flows active timed out: 0

Passive monitoring interface: mo-4/1/0, Local interface index: 45
  Flow information
    Flow packets: 6537780, Flow bytes: 653778000
    Flow packets 10-second rate: 0, Flow bytes 10-second rate: 0
    Active flows: 0, Total flows: 1601
    Flows exported: 1601, Flows packets exported: 55
    Flows inactive timed out: 1601, Flows active timed out: 0

Passive monitoring interface: mo-4/2/0, Local interface index: 46
  Flow information
    Flow packets: 6529259, Flow bytes: 652925900
    Flow packets 10-second rate: 0, Flow bytes 10-second rate: 0
    Active flows: 0, Total flows: 1599
    Flows exported: 1599, Flows packets exported: 55
    Flows inactive timed out: 1599, Flows active timed out: 0

Passive monitoring interface: mo-4/3/0, Local interface index: 47
  Flow information
    Flow packets: 6560741, Flow bytes: 656074100
    Flow packets 10-second rate: 0, Flow bytes 10-second rate: 0
    Active flows: 0, Total flows: 1598
    Flows exported: 1598, Flows packets exported: 55
    Flows inactive timed out: 1598, Flows active timed out: 0
| 畑 |
説明 |
|---|---|
| 割り当てカウント |
割り当てられたフロー レコードの数。 |
| フリーカウント |
解放されたフロー レコードの数。 |
| 割り当てられる最大数 |
監視ステーションが起動してから割り当てられたフロー レコードの最大数。この数は、一度に割り当てられるフロー レコードのピーク数を表します。 |
| 割り当て数/秒 |
PICの最後の統計間隔中に割り当てられたフローレコード/秒。 |
| フリー数/秒 |
PICの最後の統計間隔中に解放されたフローレコード/秒。 |
| 合計メモリ使用量 |
現在使用されているメモリの総量(バイト単位)。 |
| 空きメモリの合計 |
現在空いているメモリの総量(バイト単位)。 |
user@host> show passive-monitoring memory all
Passive monitoring interface: mo-4/0/0, Local interface index: 44
  Memory utilization
    Allocation count: 1600, Free count: 1599, Maximum allocated: 1600
    Allocations per second: 3200, Frees per second: 1438
    Total memory used (in bytes): 103579176, Total memory free (in bytes): 163914184

Passive monitoring interface: mo-4/1/0, Local interface index: 45
  Memory utilization
    Allocation count: 1602, Free count: 1601, Maximum allocated: 1602
    Allocations per second: 3204, Frees per second: 1472
    Total memory used (in bytes): 103579176, Total memory free (in bytes): 163914184

Passive monitoring interface: mo-4/2/0, Local interface index: 46
  Memory utilization
    Allocation count: 1600, Free count: 1599, Maximum allocated: 1600
    Allocations per second: 3200, Frees per second: 1440
    Total memory used (in bytes): 103579176, Total memory free (in bytes): 163914184

Passive monitoring interface: mo-4/3/0, Local interface index: 47
  Memory utilization
    Allocation count: 1599, Free count: 1598, Maximum allocated: 1599
    Allocations per second: 3198, Frees per second: 1468
    Total memory used (in bytes): 103579176, Total memory free (in bytes): 163914184
| 畑 |
説明 |
|---|---|
| インターフェイスの状態 |
インターフェイスが監視中(正常に動作)、無効(管理上無効)、または監視なし(未設定)を示します。 |
| グループインデックス |
PIC がメンバーである監視グループを表す整数。(監視グループ数は示されません。 |
| エクスポート間隔 |
フロー レコードの設定されたエクスポート間隔(秒単位)。 |
| エクスポート形式 |
構成されたエクスポート形式 (v5 のみが現在サポートされています)。 |
| 議定書 |
PIC が監視するように設定されているプロトコル(IPv4 のみ現在サポートされています)。 |
| エンジン型式 |
出力フローパケットに挿入される設定済みエンジンタイプ。 |
| エンジンID |
出力フローパケットに挿入される設定済みエンジンID。 |
| ルート レコード カウント |
記録されたルートの数。 |
| IFL から SNMP へのインデックス カウント |
SNMPインデックスにマッピングされた論理インターフェイスの数。 |
| ASカウント |
フローが通過したAS境界の数。 |
| 設定時間 |
タイムスタンプが適用されているかどうかを示します。 |
| 構成セット |
監視設定が設定されているかどうかを示します。 |
| ルートレコードセット |
ルートが記録されているかどうかを示します。 |
| IFL SNMP マップ セット |
論理インターフェイスがSNMPインデックスにマッピングされているかどうかを示します。 |
user@host> show passive-monitoring status all
Passive monitoring interface: mo-4/0/0, Local interface index: 44
  Interface state: Monitoring
  Group index: 0
  Export interval: 15 secs, Export format: cflowd v5
  Protocol: IPv4, Engine type: 1, Engine ID: 1
  Route record count: 13, IFL to SNMP index count: 30, AS count: 1
  Time set: Yes, Configuration set: Yes
  Route record set: Yes, IFL SNMP map set: Yes

Passive monitoring interface: mo-4/1/0, Local interface index: 45
  Interface state: Monitoring
  Group index: 0
  Export interval: 15 secs, Export format: cflowd v5
  Protocol: IPv4, Engine type: 1, Engine ID: 2
  Route record count: 13, IFL to SNMP index count: 30, AS count: 1
  Time set: Yes, Configuration set: Yes
  Route record set: Yes, IFL SNMP map set: Yes

Passive monitoring interface: mo-4/2/0, Local interface index: 46
  Interface state: Monitoring
  Group index: 0
  Export interval: 15 secs, Export format: cflowd v5
  Protocol: IPv4, Engine type: 1, Engine ID: 3
  Route record count: 13, IFL to SNMP index count: 30, AS count: 1
  Time set: Yes, Configuration set: Yes
  Route record set: Yes, IFL SNMP map set: Yes

Passive monitoring interface: mo-4/3/0, Local interface index: 47
  Interface state: Monitoring
  Group index: 0
  Export interval: 15 secs, Export format: cflowd v5
  Protocol: IPv4, Engine type: 1, Engine ID: 4
  Route record count: 13, IFL to SNMP index count: 30, AS count: 1
  Time set: Yes, Configuration set: Yes
  Route record set: Yes, IFL SNMP map set: Yes
| 畑 |
説明 |
|---|---|
| アップタイム |
PICが動作している時間(ミリ秒)。 |
| 割り込み時間 |
前回のPICリセット以降、PICがパケットの処理に費やした累積時間。 |
| 読み込み (5 秒) |
PICのCPU負荷は5秒間の平均です。この数値は、アクティブなタスクに費やされた時間を合計経過時間で割った割合です。 |
| 読み込み(1分) |
PICのCPU負荷は1分間の平均です。この数値は、アクティブなタスクに費やされた時間を合計経過時間で割った割合です。 |
user@host> show passive-monitoring usage *
Passive monitoring interface: mo-4/0/0, Local interface index: 44
  CPU utilization
    Uptime: 653155 milliseconds, Interrupt time: 40213754 microseconds
    Load (5 second): 20%, Load (1 minute): 17%

Passive monitoring interface: mo-4/1/0, Local interface index: 45
  CPU utilization
    Uptime: 652292 milliseconds, Interrupt time: 40223178 microseconds
    Load (5 second): 22%, Load (1 minute): 15%

Passive monitoring interface: mo-4/2/0, Local interface index: 46
  CPU utilization
    Uptime: 649491 milliseconds, Interrupt time: 40173645 microseconds
    Load (5 second): 22%, Load (1 minute): 10098862%

Passive monitoring interface: mo-4/3/0, Local interface index: 47
  CPU utilization
    Uptime: 657328 milliseconds, Interrupt time: 40368704 microseconds
    Load (5 second): 1%, Load (1 minute): 15%