JCNR-vRouter
この章を読んで、JCNR-vRouter(JCNR DPDK ベースの転送プレーン)の詳細をご確認ください。
JCNR vRouter のメリット
-
DPDK を JCNR-vRouter に統合:
-
転送プレーンは、カーネルベースの転送よりも高速な転送機能を提供
-
転送プレーンはカーネルベースの転送よりも拡張性が高い
-
以下のNICをサポートしています。
-
Intel E810(コロンビアビル)とインテルアダプター仮想機能(IAVF)および動的デバイスパーソナライゼーション(DDP)
-
Intel XL710(フォートビル)、インテルアダプター仮想機能(IAVF)
メモ:INTEL XL710 NIC で DDP はサポートされていません。
-
-
-
インターフェイスサポート:
-
virtioを使用したPODインターフェイス
-
カーネル
vethペアを使用したPODインターフェイス -
DPDK仮想機能(VF)ワークロードインターフェイス
-
DPDK VF ファブリック トランク インターフェイス
vRouter 展開で使用される values.yaml ファイルで DPDK VF ファブリック トランク インターフェイスを定義します。これにより、JCNR はインターフェイスの名前、MAC アドレス、および PCI スロット ID を認識できます。トラフィック フローを管理しやすくするために、VLAN フィルタリングを物理インターフェイスに適用します。クラウドネイティブルーターで使用するようにVLANを設定すると、設定されたVLANのみが物理インターフェイスで通過できます。
ワークロード インターフェイスとして values.yaml で定義された物理インターフェイスには、1 つの受信キューと 1 つの送信キューのみが装備されています。システムは、トラフィックのインターフェイスをポーリングするタスクに、1つの転送CPUコアを割り当てます。ファブリックインターフェイスとして 値で 定義された物理インターフェイスは、ポーリングを処理するために転送CPUコアを割り当てるのと同じ数の受信および送信キューを装備しています。たとえば、ファブリック インターフェイスに 3 つの転送 CPU コアを割り当てる場合、システムは 3 つの受信キューと 3 つの送信キューをインターフェイスに割り当てます。
-
-
インターフェイスの貼り付け
DPDK vRouterは、DPDK VFファブリックインターフェイス上のアクティブ/スタンバイモードでインターフェイスボンディングをサポートします。 value.yaml ファイルは、インターフェイス名、モード値、プライマリおよびセカンダリ(スレーブ)インターフェイス指定を指定します。DPDKには、接着に使用する独自の接着ドライバを備えたライブラリが含まれています。運用中、vRouter はプライマリ インターフェイスを使用してトラフィックを渡します。プライマリリンクがダウンした場合、ペアのセカンダリインターフェイスは、プライマリインターフェイスが再接続するまでトラフィックを渡します。
-
ポッド DPDK インターフェイス
JCNR-vRouter は、POD アプリケーションへの virtio 通信をサポートします。JCNR-CNI は、Pod アプリケーションおよび vRouter に渡される固有のソケット・ディレクトリーを割り当てます。JCNR-CNIでは、vhostソケットとPodボリュームマウントを分離することで、1つのポッドが別のPodのリソースにアクセスできないようにします。
-
ポッドカーネルインターフェイス
JCNR は、Linux カーネルのネットワーク スタックを使用する Pod アプリケーションと通信するための veth インターフェイス タイプをサポートしています。
vRouter CLI へのアクセス方法
kubectl get pods -n contrail
上記のコマンドの出力は次のようになります。
NAME                             READY   STATUS    RESTARTS   AGE
contrail-vrouter-masters-97v8z   3/3     Running   0          6d1h
vRouter-agent CLIにアクセスするには、以下のコマンドでシステムのポッド名をフルに使用します。
kubectl exec -n contrail -it contrail-vrouter-masters-97v8z -- bash
上記のコマンドの出力は次 Defaulted container "contrail-vrouter-agent" out of: contrail-vrouter-agent, contrail-vrouter-agent-dpdk, contrail-vrouter-telemetry-exporter, contrail-init (init), contrail-vrouter-kernel-init-dpdk (init)のようになります。
vRouter CLI を使用すると、システムを監視およびトラブルシューティングするために実行できるコマンドが数多く存在します。CLI コマンドによる vRouter の監視で利用可能なコマンドの一部を示します。
vRouter のパケット フロー
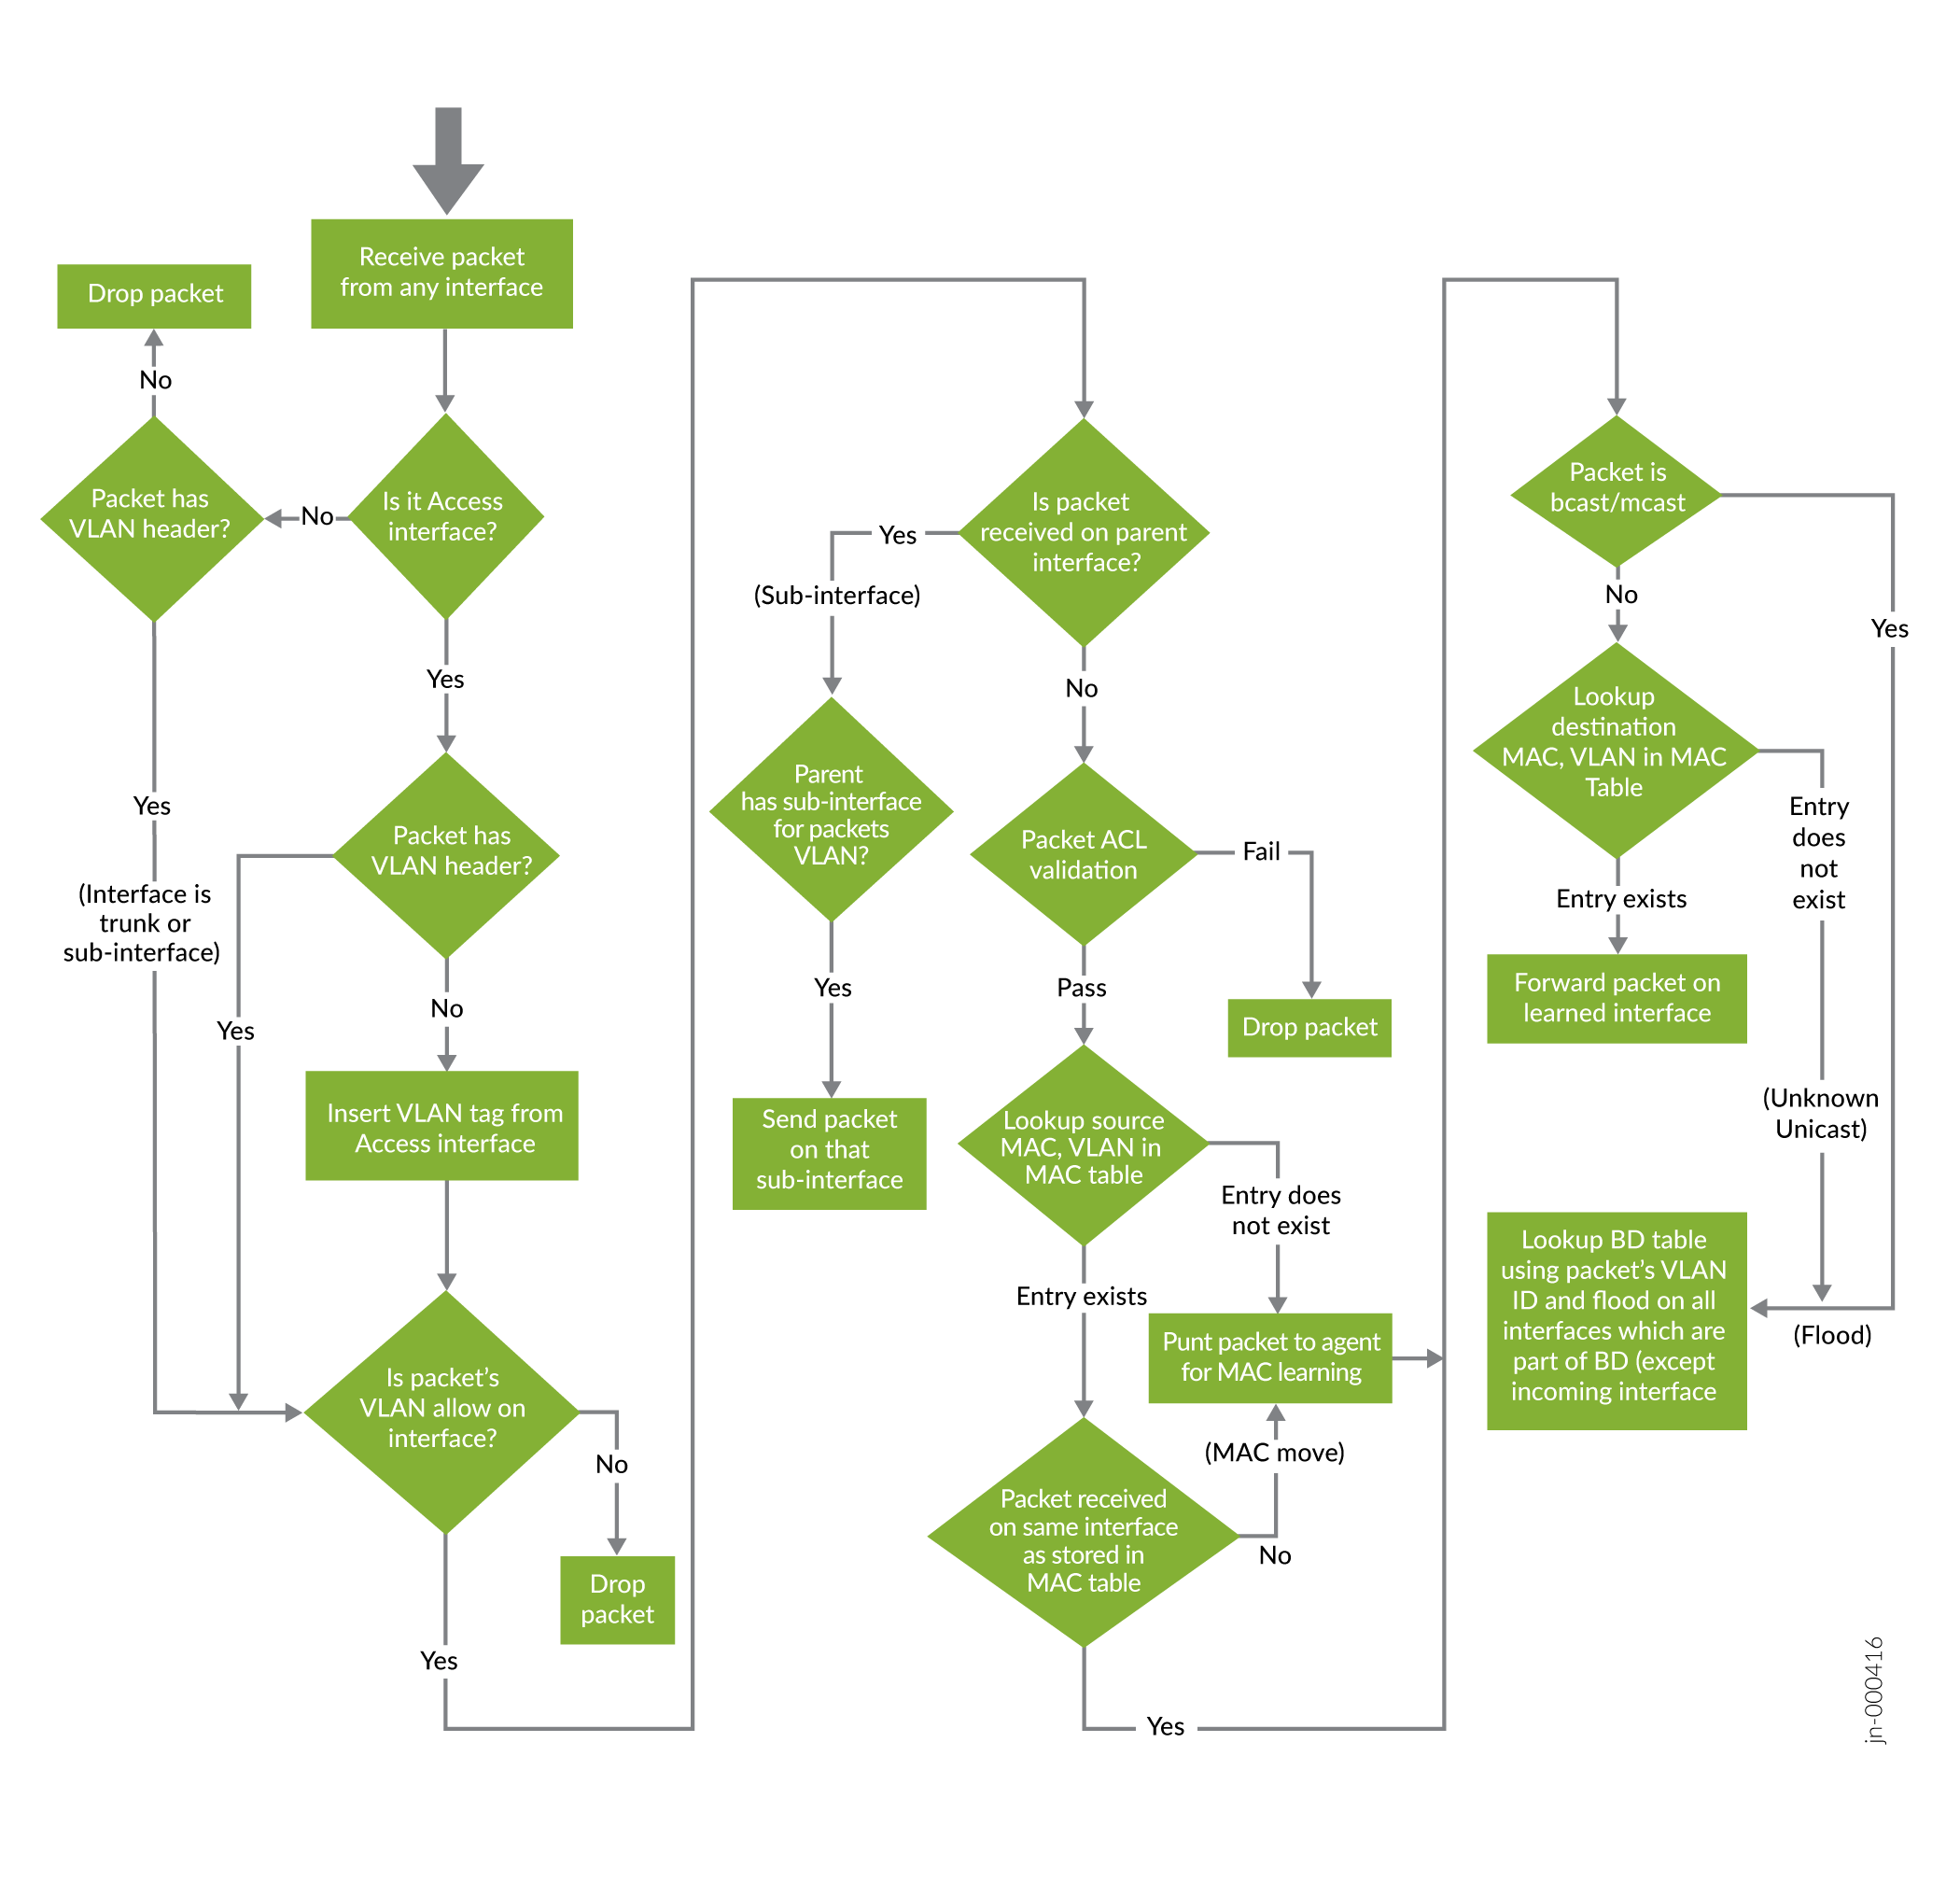
スイッチやルーターなどを理解する必要がある場合は、パケットが通過する際に何が起こるかを知っておくと便利です。このセクションでは、vRouter でのパケットの寿命について説明します。この説明を使用して、vRouter MAC およびブリッジ ドメイン(BD)テーブルがどのように入力されているかを説明し、内部から vRouter のさまざまな部分を見るために使用できる CLI コマンドをいくつか紹介します。
以下のフロー チャートは、クラウドネイティブ ルーターを通る汎用パケット フローの 1 つを示しています。これは、パケットとのすべての可能な相互作用をカバーしているわけではありません。
 におけるパケットの寿命
ご覧のように、vRouter は受信したパケットに関して多くの決定を行い、パケットが正しく処理されるようにします。vRouter がパケットで行う機能をいくつか見てみましょう。上の図では、VLAN またはブリッジ ドメイン(BD)に基づいていくつかの選択肢があります。vRouter が転送の決定で参照するテーブルの 1 つが BD テーブルです。BD テーブルの小さな例を以下に示します。
| VLAN ID(キー) | インターフェイス ID リスト(値) |
|---|---|
| 1024 | 2,3,4 |
| 1042 | 4,5 |
| 1022 | 1 |
| 1044 | 6 |
BD テーブルは、特定の VLAN ID を持つトラフィックを伝送できるインターフェイスを vRouter に伝えます。そのため、VLAN ID はテーブルのキーとして機能し、インターフェイス ID リストは各エントリの値として機能します。
BD テーブルと密接に関連しているのが MAC テーブルです。MAC テーブルは、MAC アドレスと VLAN ID をキー ペアとして使用します。次に、インターフェイスIDとヒットカウントは、テーブル内の各エントリーの値として機能します。以下に例を示します。
| MAC アドレス | VLAN ID | インターフェイス ID | ヒット カウント |
|---|---|---|---|
| 00:11:22:33:44:55 | 1024 | 2 | 123234 |
| 00:22:33:44:55:66 | 1042 | 4 | 823948 |
| 00:33:44:55:66:77 | 1022 | 1 | 45980 |
| 00:44:55:66:77:88 | 1044 | 6 | 86578 |
MAC テーブルの主な目的は、どの MAC アドレスがどのインターフェイスを通じて到達できるかをマッピングすることです。vRouter は、 にエントリーを作成し、パケットの処理中に MAC テーブルを調べます。
CLI コマンドによる vRouter の監視
vRouter では、CLI コマンドはトラブルシューティングや監視の目的で役立ちます。 「vRouter CLI にアクセスする方法」で説明したように、vRouter の CLI にアクセスできます。その CLI でコマンドを実行することで、vRouter を実行しているさまざまな側面について学習できます。以下の例では、すでに vRouter CLI に接続していることを前提としています。このセクションに表示されるコマンドには、コマンド プロンプトが表示されないため、独自の vRouter にコピー アンド ペーストできます。
次のほとんどの例で purel2cli コマンドを使用します。コマンドには、例で示したよりも多くのオプションがあります。さらに、 purel2cli には、使用可能なオプションを表示するために使用できるヘルプ コマンドがあります。
The purel2cli Command
To see all the options of the purel2cli command in the vRouter CLI, execute the command with the --help option.
purel2cli --help
Usage: purel2cli [--mac show]
	   [--vlan show]
	   [--vlan get <VLAN_ID>]
	   [--acl show <VLAN_ID>]
	   [--acl reset-counters <VLAN_ID>]
	   [--l2stats get <VIF_ID> <VLAN_ID>]
	   [--clear VLAN_ID]
	   [--sock-dir <sock dir>]
	   [--help]
See the Current Status of Your Running vRouter
To see the status of the vRouter, enter the following command in the vRouter CLI:
ps -eaf|grep dpdk
The output from the command above looks like: root 127 93 99 Jul29 ? 82-20:31:49 /contrail-vrouter-dpdk --no-daemon --socket-mem=1024 1024 --allow=0000:01:10.1 --allow=0000:01:10.0 --l2_table_size=10240 --yield_option 0 --ddp --l2_mode
There are several things shown in the output:
| Flag | Meaning |
|---|---|
--l2_mode |
The vRouter is running in L2 mode. |
--l2_table_size |
The current number of entries in the MAC table. The default size is 10240 entries. |
--allow=<PCI Id> |
The PCI ID of fabric and fabric workload interfaces. More than one ID can appear in the output. These IDs serve as an allowlist. |
--ddp |
Enable Intel DDP support. We enable DDP by default in the values.yaml file in the vRouter.
Note:
The Intel XL710 NIC does not support DDP. |
Show MAC Table
The following command shows the MAC addresses that the vRouter has dynamically learned.
purel2cli --mac show
The output from the above command looks like:
==================================================
||  MAC            vlan      port      hit_count||
==================================================
00:01:01:01:01:03  1221      2          1101892
00:01:01:01:01:02  1221      2          1101819
00:01:01:01:01:04  1221      2          1101863
00:01:01:01:01:01  1221      2          1101879
5a:4c:4c:75:90:fe  1250      5          12
Total Mac entries 5
Show Bridge Domain Table
The following command shows the VLAN to port mapping in the vRouter.
purel2cli --vlan show
The output from the above command looks like:
VLAN      PORT
===============
1201      1,2,3,4,
1202      1,2,3,4,
1203      1,2,3,4,
1204      1,2,3,4,
1205      1,2,3,4,
You can use the following form of the purel2cli command to see the bridge domain table entry for a specific VLAN: purel2cli --vlan get <vlan-id>
Show L2 Statistics
There are several command variations of the purel2cli command that allow you to display and filter L2 statistics in the vRouter. The base form of the command is: purel2cli -- l2stats get <virtual_interface_ID> <VLAN_ID>. The table below shows the available command options and what they do. We follow the table with a sample output using one of the options.
| Sample Command | Function |
|---|---|
purel2cli --l2stats get '*' '*' |
Get statistics for all virtual interfaces (vif) and all VLAN IDs. |
purel2cli --l2stats get '*' 100 |
Get statistics for all vif that are part of VLAN 100 |
purel2cli --l2stats get 1 '*' |
Get statistics for all VLANs for which interface 1 is a member |
purel2cli --l2stats get 1 100 |
Get statistics for interface 1 and VLAN 100 |
As an example, the following command shows the L2 statistics for interface 2 and VLAN 1221:
purel2cli --l2stats get 2 1221
Vlan id count: 1
--------------------------------------------------------------------------------
Statistics for vif 2 vlan 1221
--------------------------------------------------------------------------------
                Rx Pkts           Rx Bytes          Tx Pkts            Tx Bytes
Unicast        245344824       48152682842           835552          1667761792
Broadcast              0                 0                0                   0
Multicast              0                 0                0                   0
Flood                  0                 0                0                   0
--------------------------------------------------------------------------------
Clear L2 Statistics
The following example shows commands that allow you to clear L2 statistics information from the vRouter.
You can clear the statistics from the vRouter with the purel2cli command in the form: purel2cli --clear <VLAN_ID>.
purel2cli --clear '*'
purel2cli --clear 100
dropstats コマンド
vRouter は、ドロップしたパケットを何らかの理由で追跡します。以下の表は、vRouter がパケットをドロップする最も一般的な理由を示しています。 dropstats コマンドを実行すると、そのカウンターのカウントが 0 の場合、vRouter はカウンターを表示しません。
| カウンター名の | 意味 |
|---|---|
L2 bd table drop |
ブリッジ ドメインにインターフェイスなし |
L2 untag pkt drop |
タグなしパケットがトランクまたはサブインターフェイスに到着 |
L2 Invalid Vlan |
パケット VLAN がインターフェイス VLAN と一致しない |
L2 Mac Table Full |
MAC テーブルで使用できるエントリーはこれ以上ありません。 |
L2 ACL drop |
パケット一致ファイアウォール フィルター(ACL)ドロップ ルール |
L2 Src Mac lookup fail |
送信元MACアドレスを照会(または学習)できない |
dropstats コマンドからの出力例は次のようになります。
dropstats
L2 bd table Drop              43
L2 untag pkt drop             716
L2 Invalid Vlan               7288253
Rate limit exceeded           673179706
L2 Mac Table Full             41398787
L2 ACL drop                   8937037
L2 Src Mac lookup fail        247046
dpdkinfo コマンド
dpdkinfo コマンドは、DPDK のステータスと統計に関する情報を提供します。dpdkinfo コマンドには多くのオプションがあります。まず、利用可能なオプションを示し、次に dpdkinfo コマンドからの出力例を示します。vRouter-agent CLI 内からのみ dpdkinfo コマンドを実行できます。
dpdkinfo Command Usage
dpdkinfo
Usage: dpdkinfo [--help]
                 --version|-v                                                      Show DPDK Version
                 --bond|-b                                                         Show Master/Slave bond information
                 --lacp|-l     <all/conf>                                          Show LACP information from DPDK
                 --mempool|-m  <all/<mempool-name>>                                Show Mempool information
                 --stats|-n    <vif index value>                                   Show Stats information
                 --xstats|-x   <vif index value>                                   Show Extended Stats information
                 --lcore|-c                                                        Show Lcore information
                 --app|-a                                                          Show App information
                 --ddp|-d      <list> <list-flow>						   Show DDP information for X710 NIC
                 --rx_vlan|-z  <value>                                             Show VLan information
       Optional: --buffsz      <value>                                             Send output buffer size (less than 1000Mb)
dpdkinfo Lcore Information
This command shows the Lcores assigned to DPDK VF fabric interfaces and the queue ID for each interface.
dpdkinfo -c
No. of forwarding lcores: 4

Lcore 10:
	Interface: 0000:18:01.1        Queue ID: 0
	Interface: 0000:18:0d.1        Queue ID: 0
	Interface: 0000:86:00.0        Queue ID: 0

Lcore 11:
	Interface: 0000:18:01.1        Queue ID: 1
	Interface: 0000:18:0d.1        Queue ID: 1
	Interface: 0000:86:00.0        Queue ID: 1

Lcore 12:
	Interface: 0000:18:01.1        Queue ID: 2
	Interface: 0000:18:0d.1        Queue ID: 2
	Interface: 0000:86:00.0        Queue ID: 2

Lcore 13:
	Interface: 0000:18:01.1        Queue ID: 3
	Interface: 0000:18:0d.1        Queue ID: 3
	Interface: 0000:86:00.0        Queue ID: 3
dpdkinfo Memory Pool Information
This command shows all of the memory pool information.
dpdkinfo -m all
---------------------------------------------------
Name			Size	Used	Available
---------------------------------------------------
rss_mempool         	16384	1549	14835
frag_direct_mempool 	4096	0	4096
frag_indirect_mempool	4096	0	4096
packet_mbuf_pool    	8192	2	8190
dpdkinfo Statistics Information
This command displays statistical information for a specific interface.
dpdkinfo -n 3
Interface Info(0000:18:0d.1):
RX Device Packets:6710, Bytes:1367533, Errors:0, Nombufs:0
Dropped RX Packets:0
TX Device Packets:0, Bytes:0, Errors:0
Queue Rx:
      Tx:
      Rx Bytes:
      Tx Bytes:
      Errors:
dpdkinfo Extended Statistics Information
This command displays extended statistical information for a specific interface.
dpdkinfo -x 3
Driver Name:net_iavf
Interface Info:0000:18:0d.1
Rx Packets:
	rx_good_packets: 6701
	rx_unicast_packets: 0
	rx_multicast_packets: 2987
	rx_broadcast_packets: 3714
	rx_dropped_packets: 0
Tx Packets:
	tx_good_packets: 0
	tx_unicast_packets: 0
	tx_multicast_packets: 0
	tx_broadcast_packets: 0
	tx_dropped_packets: 0
Rx Bytes:
	rx_good_bytes: 1365696
Tx Bytes:
	tx_good_bytes: 0
Errors:
	rx_missed_errors: 0
	rx_errors: 0
	tx_errors: 0
	rx_mbuf_allocation_errors: 0
	inline_ipsec_crypto_ierrors: 0
	inline_ipsec_crypto_ierrors_sad_lookup: 0
	inline_ipsec_crypto_ierrors_not_processed: 0
	inline_ipsec_crypto_ierrors_icv_fail: 0
	inline_ipsec_crypto_ierrors_length: 0
Others:
	inline_ipsec_crypto_ipackets: 0
---------------------------------------------------------------------
vRouter のトラブルシューティング
vRouterエージェントのデバッグには、イントロスペクションを使用します。ホスト サーバー IP>:8085 http://<のイントロスペクション データにアクセスします。表示可能なデータの例を以下に示します。
以下の表に示す出力をグループ化しました。クラウドネイティブルーターは、ライブシステムで出力をグループ化またはソートしません。
ホスト サーバーの IP アドレス http://<表示されるページ >:8085 には、html リンクのリストのみが表示されます。リンク一覧の項目は太字で表示されます。
| グループ | リンクと説明 |
|---|---|
| Contrail-vrouter-agent 用モジュール |
|