Help us improve your experience.

Let us know what you think.

Do you have time for a two-minute survey?


設計図ダッシュボード

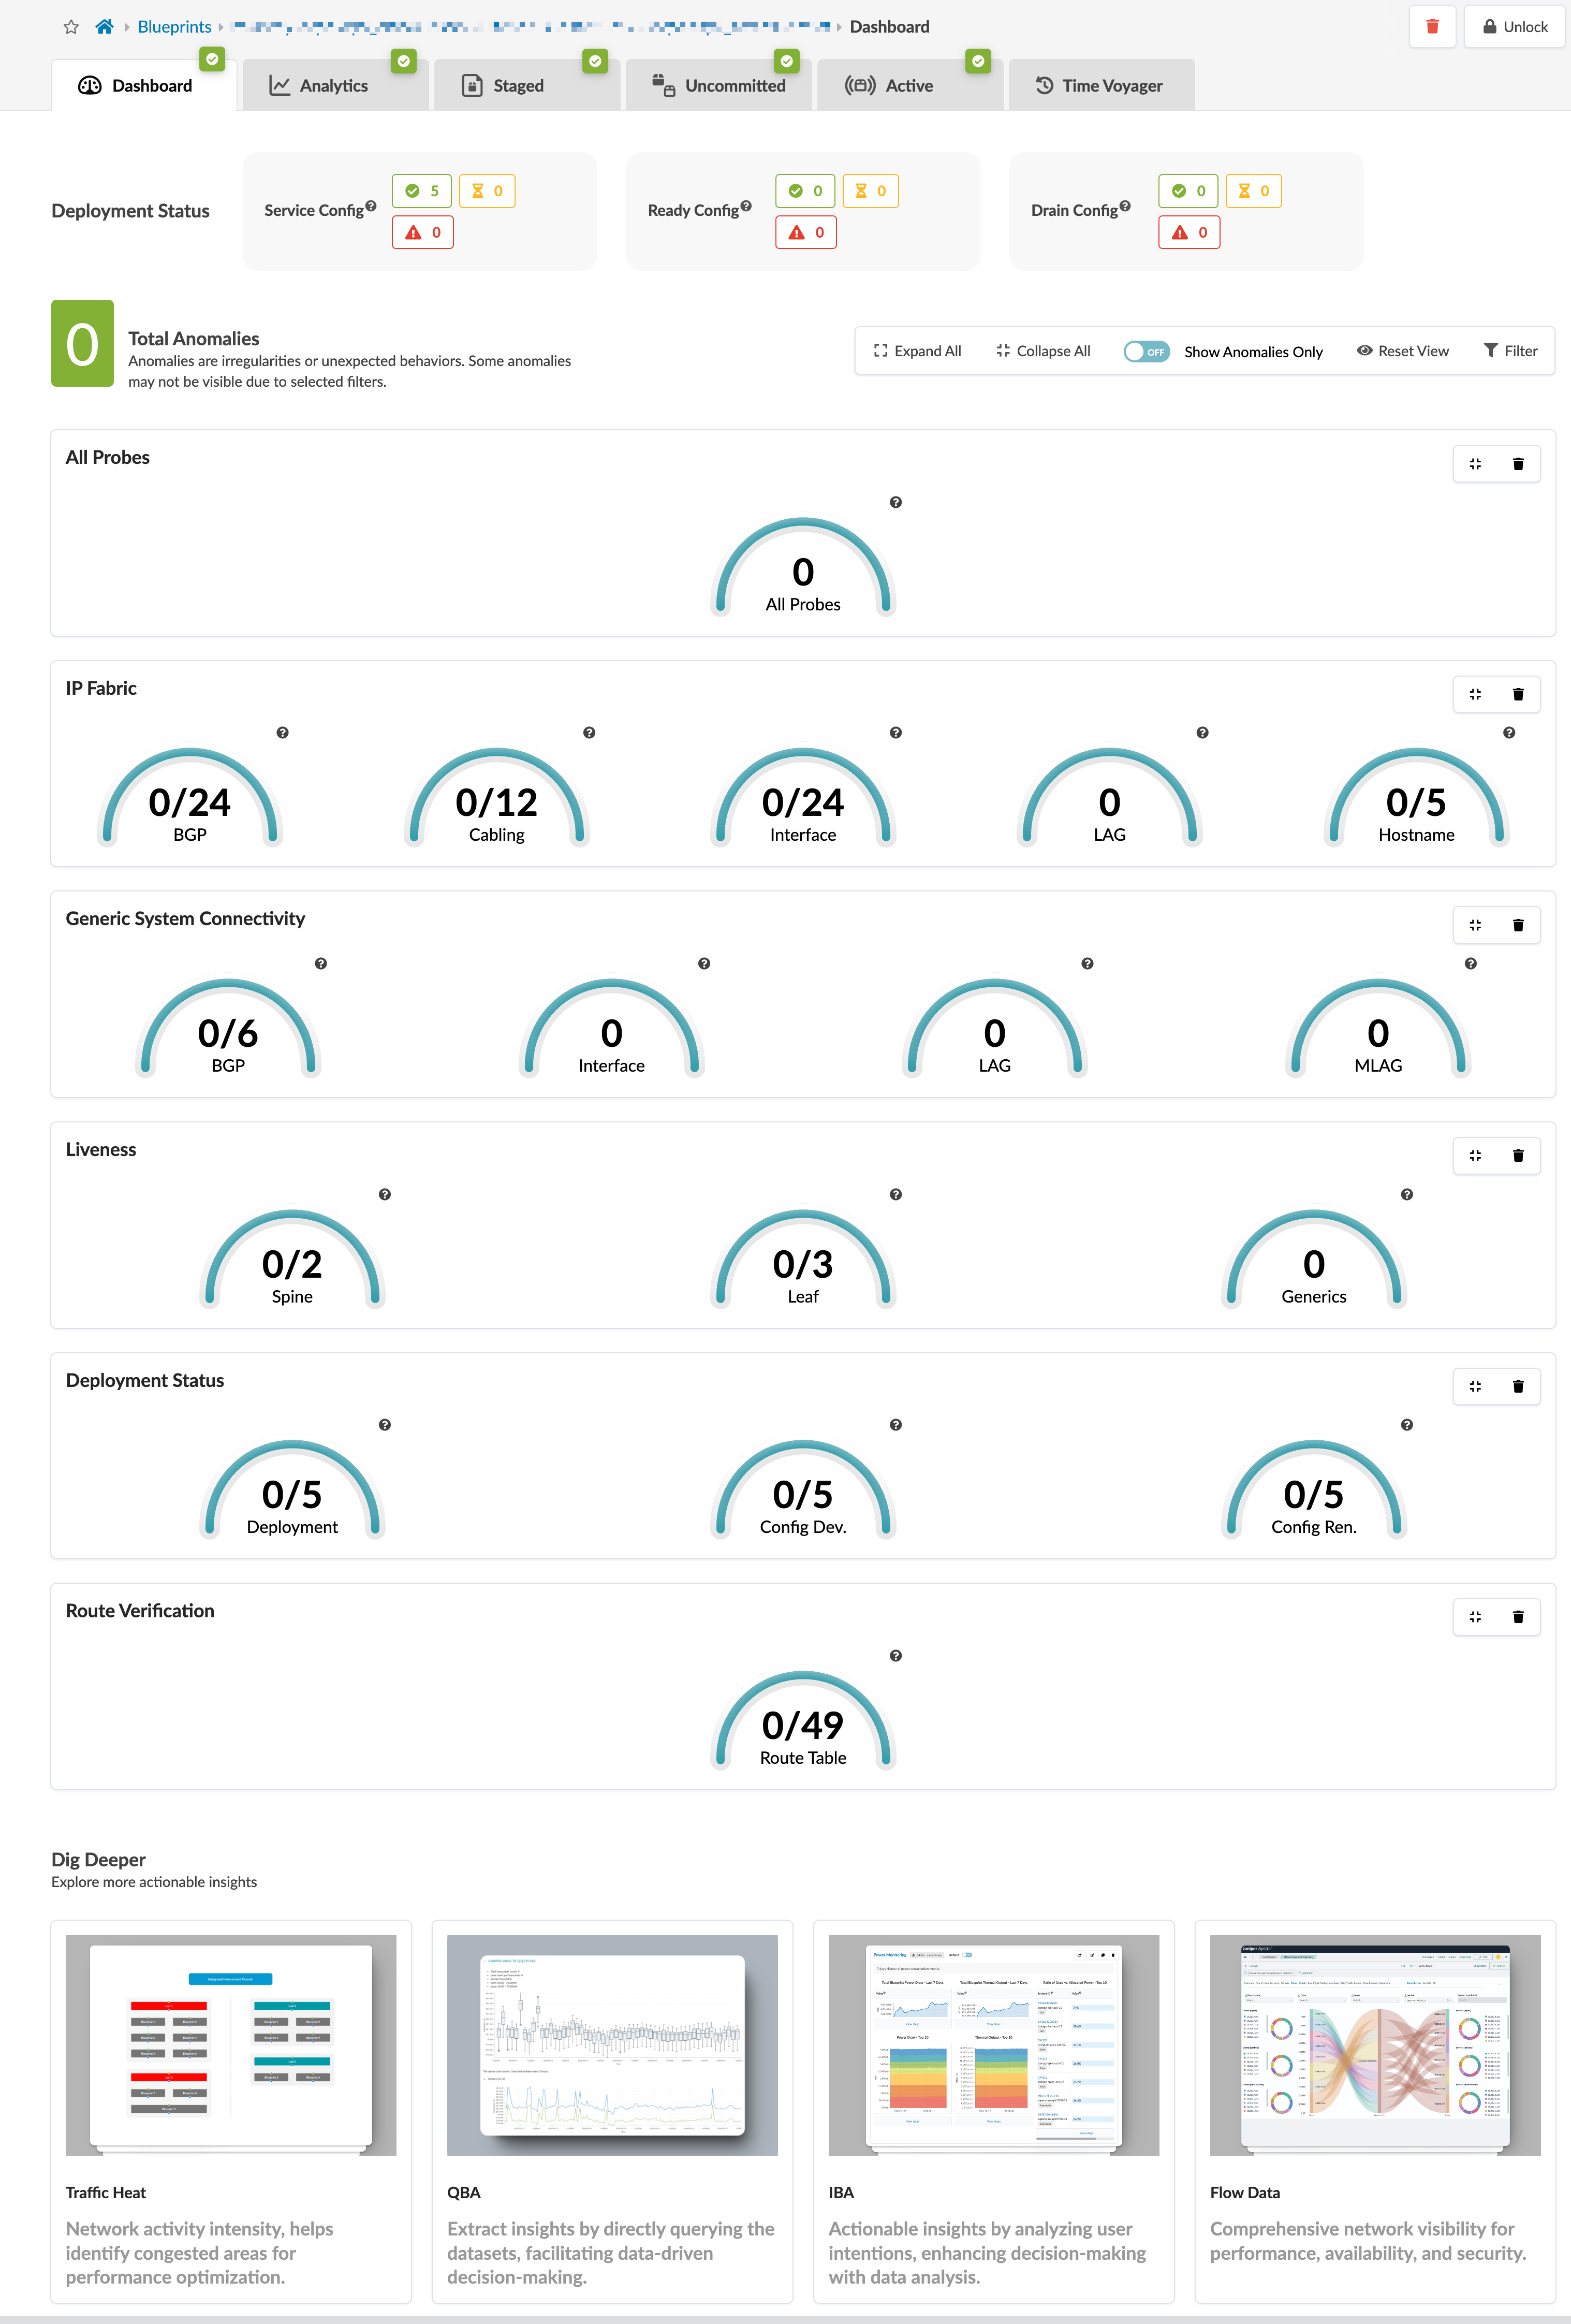
ブループリントダッシュボードには、ネットワークの全体的な健全性とステータスが表示されます。

GUIからブループリントダッシュボードに移動するには、次の手順に従います。

左側のナビゲーションメニューで、 ブループリントをクリックし、ブループリントの名前をクリックします。
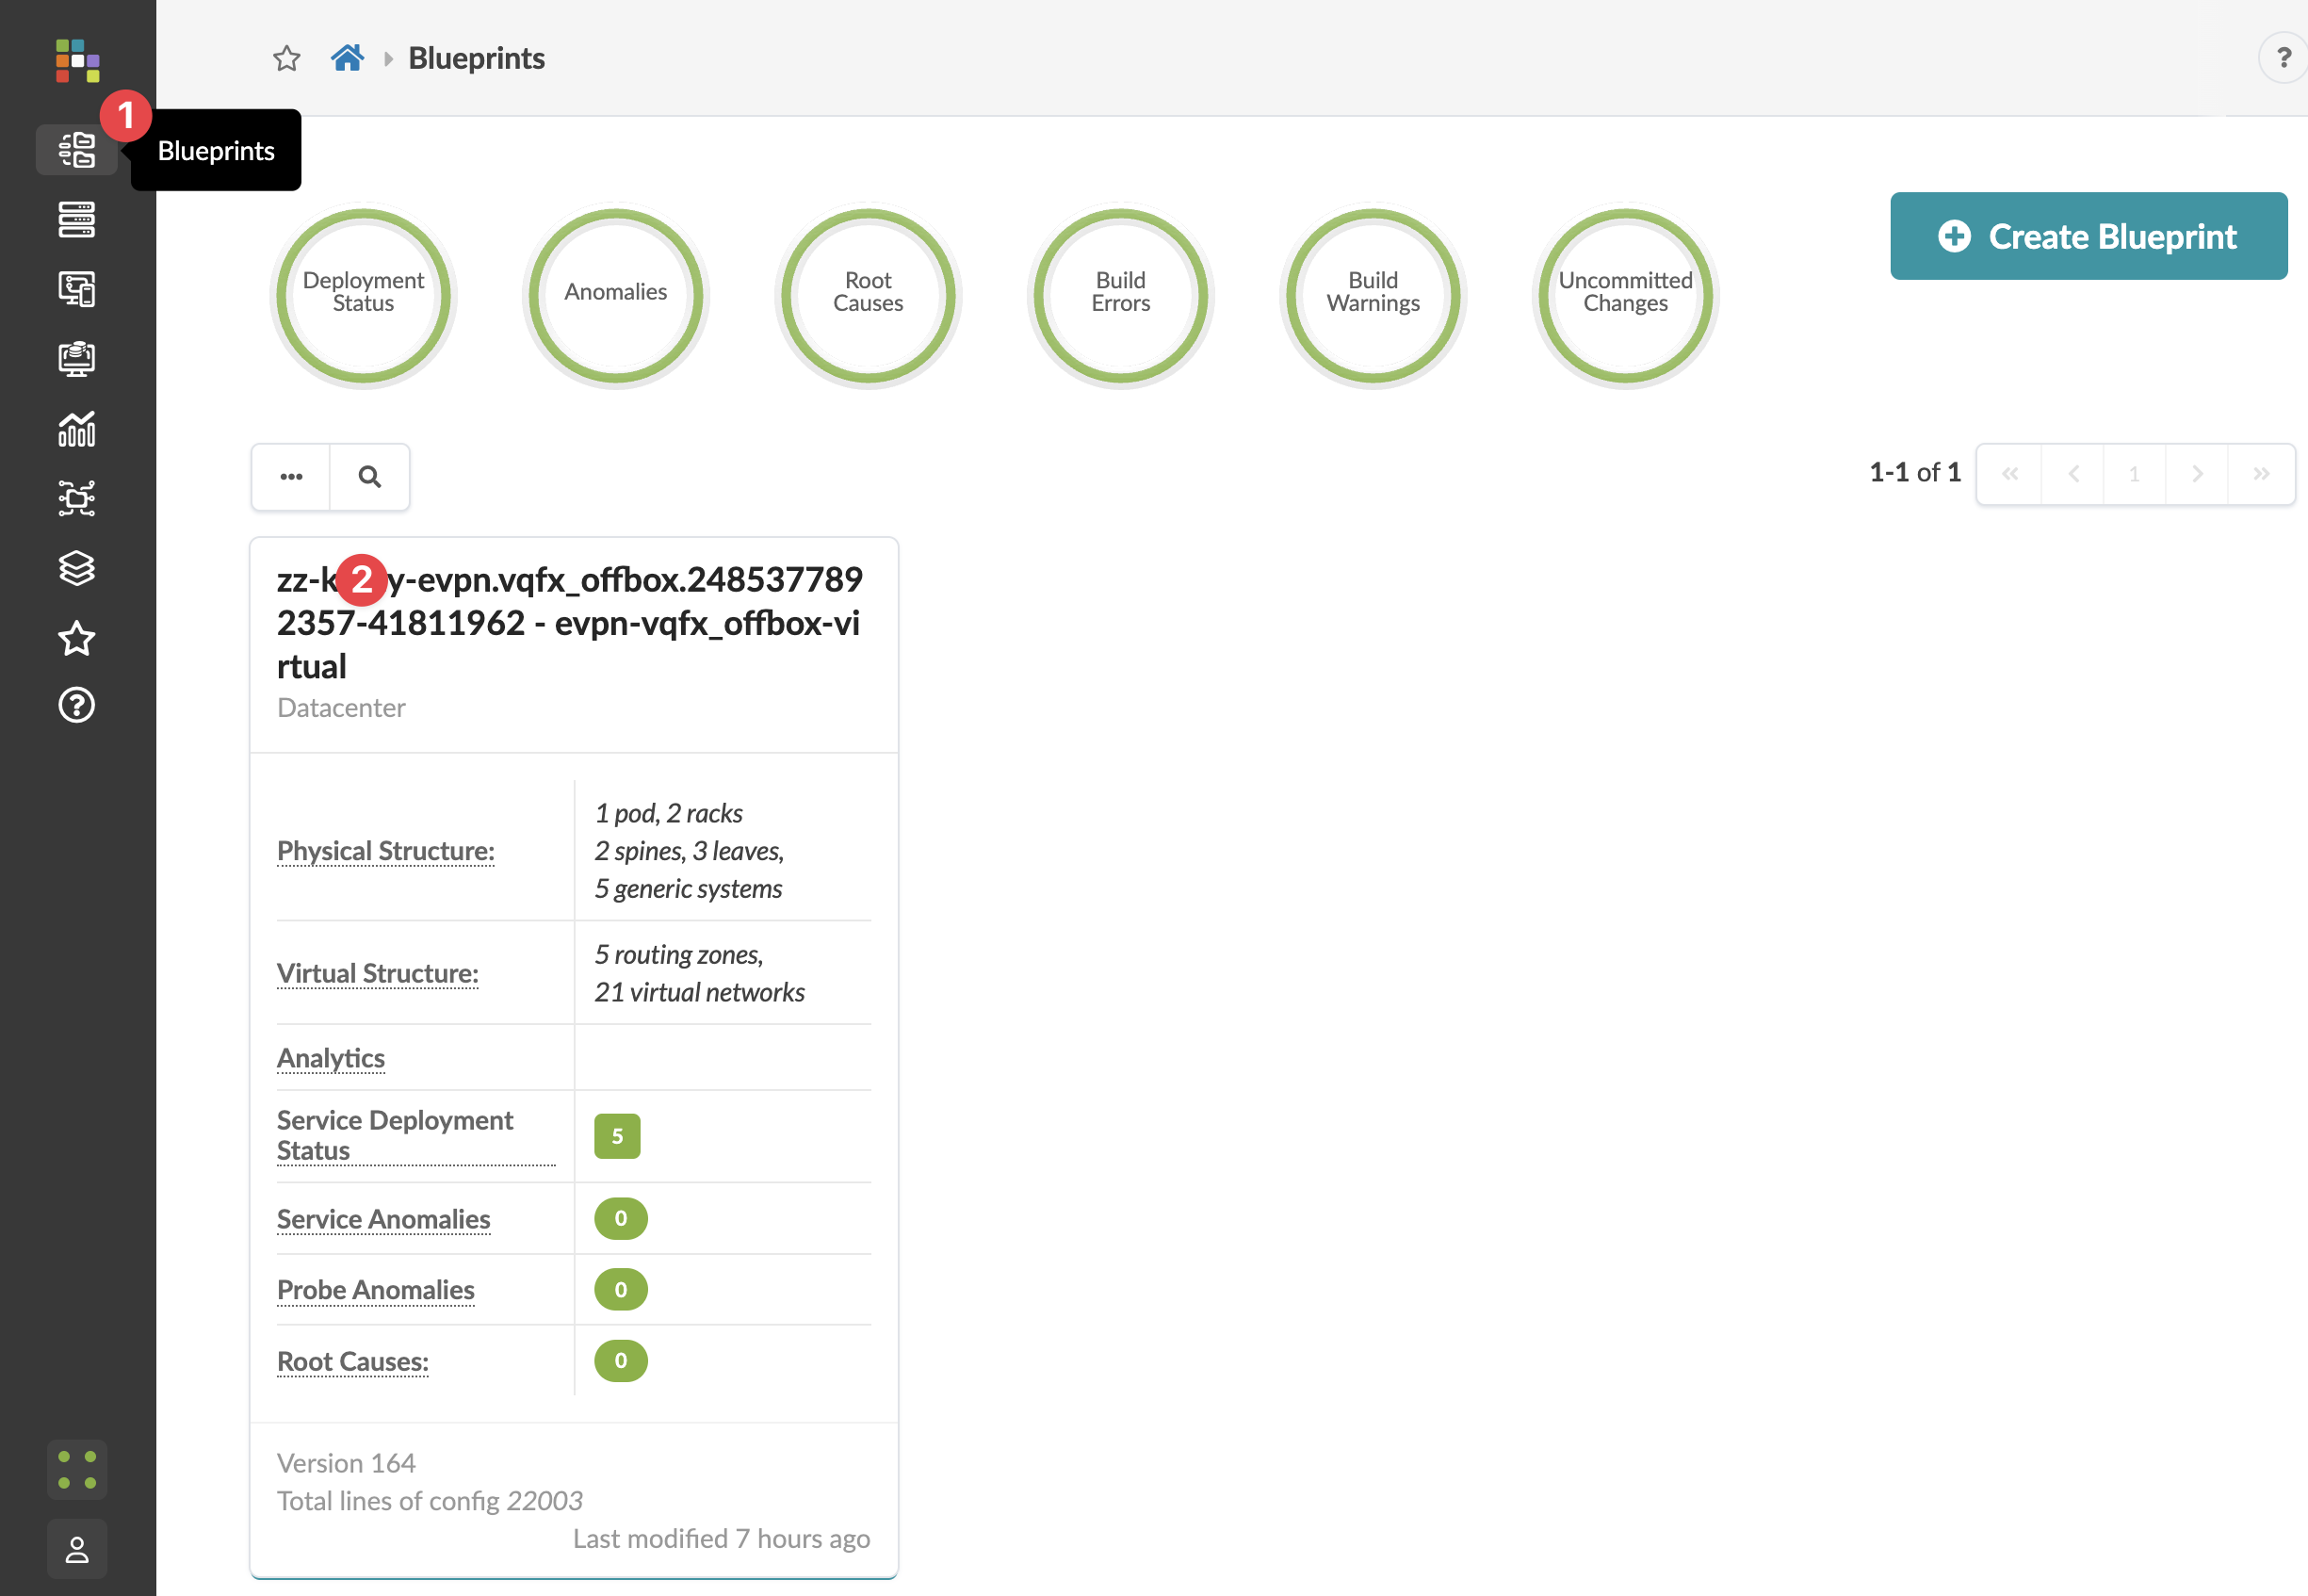
User interface from HPE application showing Blueprint details including physical and virtual structure, analytics, deployment status, and version info.

ブループリントダッシュボードが表示されます。

Error analyzing image

ダッシュボードには、ブループリントの全体的な健全性とステータスが表示されます。ステータスは色で示されます:成功した変更は緑、進行中の変更は黄色、失敗した変更は赤です。導入ステータスセクションには、サービス設定、準備完了設定、ドレイン設定のステータスが含まれます。異常セクションには、すべてのプローブ、IPファブリック、汎用システム接続、ライブネス、導入ステータス、ルート検証、リーフピアリングなどのステータスが含まれます。インジケーターをクリックすると詳細に移動できます。

設計図ダッシュボードに分析ダッシュボードを表示して、追加のネットワーク情報を1つの画面に表示できます。追加するには、 分析>ダッシュボード に移動し、分析ダッシュボードのデフォルトのトグルをオンにします。

ダッシュボードの下部には、監視と分析に使用できるブループリントの領域へのリンクが含まれています。

GPU NIC分析ハニカムダッシュボード

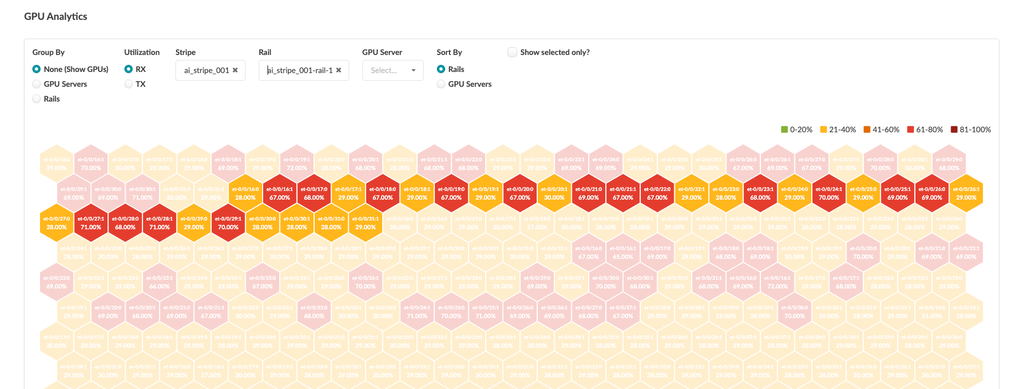
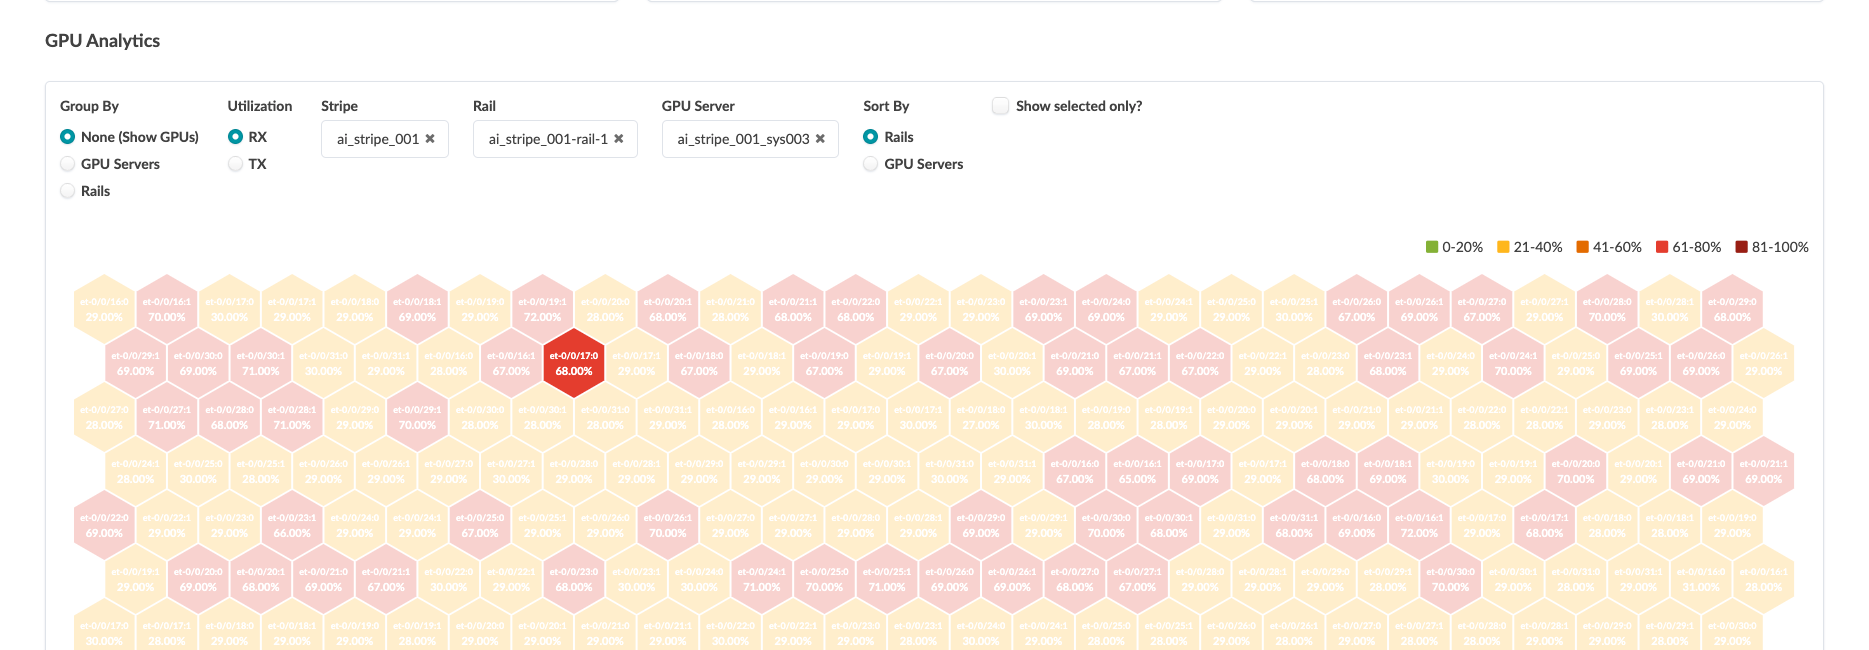
バージョン6.0では、GPU分析ハニカムダッシュボードが導入されています。このダッシュボードは、AIファブリック全体のGPUネットワークの使用状況を監視および可視化するように設計されています。ダッシュボードには、GPU NICごとの送信(Tx)および受信(Rx)トラフィックのヒートマップスタイルのビューが表示され、GPUトラフィックパターンを可視化し、GPUネットワークパフォーマンスを最適化できます。
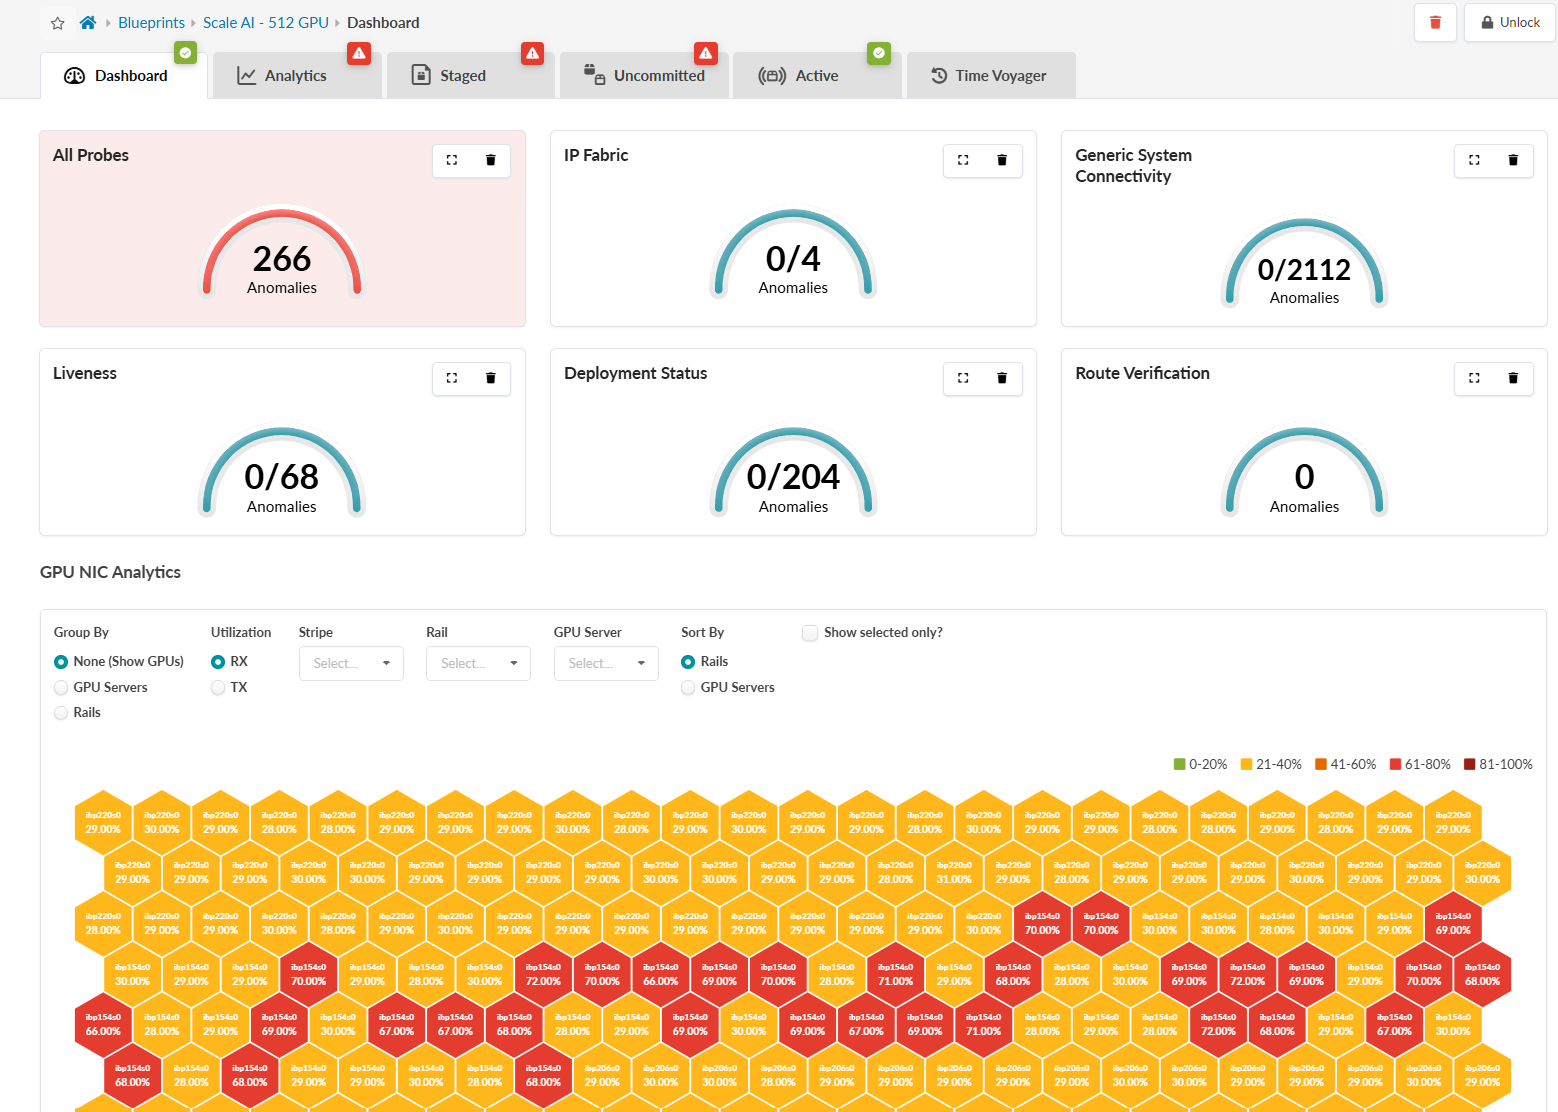
Honeycomb Analyticsダッシュボードは、Rail-OptimizedまたはRail-Collapsed構成の設計図ダッシュボードページに表示されます。ダッシュボードにはGPU分析セクションが表示され、GPUネットワークアクティビティを直感的に監視できます。

Dashboard interface for monitoring GPU infrastructure performance, showing 266 critical anomalies in All Probes and color-coded GPU server utilization.

ダッシュボードには次の機能もあります。

ヒートマップの可視化:ハニカムヒートマップは、GPU NICの使用率を表します。色分けされた六角形は、トラフィックレベルを示します。

  • 緑(0-20%)

  • 黄色(21-40%)

  • オレンジ(41-60%)

  • 赤 (61-80%)

  • ダークレッド(81-100%)

トラフィック統計:ファブリック全体のTxおよびRxトラフィックメトリックを表示するか、特定のコンポーネントをドリルダウンします。以下でトラフィックをフィルタリングできます。
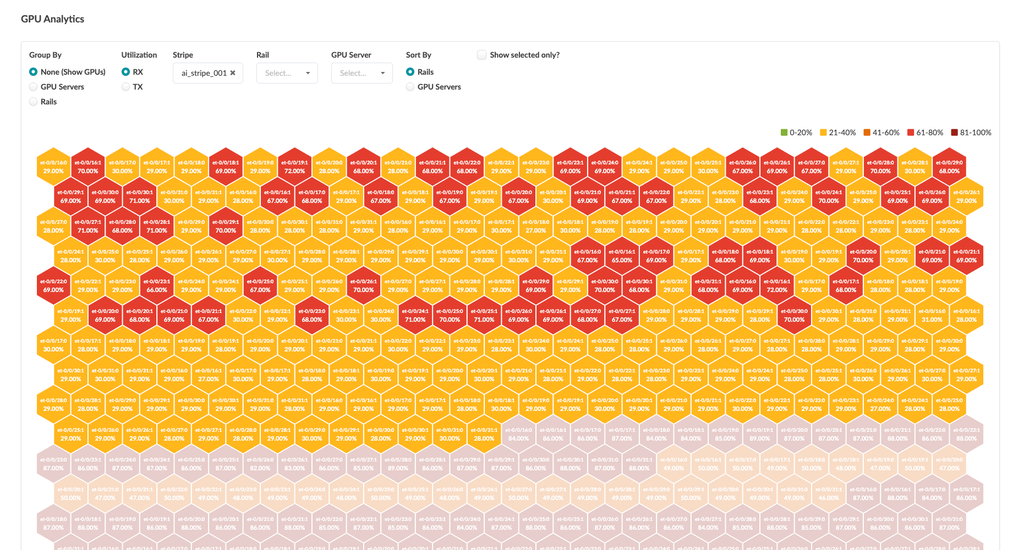
ストライプ

GPU analytics visualization with hexagonal tiles showing utilization percentages. Color-coded: Green for 0-20 percent, Yellow for 21-40 percent, Orange for 41-60 percent, Red for 61-80 percent, Dark Red for 81-100 percent. Filters and sorting options allow grouping by GPU servers or individual GPUs.
レール

GPU analytics dashboard visualizing utilization data with hexagonal cells colored by utilization percentage. Filters and sorting options for grouping and analyzing GPU performance.
GPUサーバー

GPU analytics dashboard showing utilization data in a hexagonal grid. Hexagons display utilization percentages with color coding: green for 0-20 percent, yellow for 21-40 percent, orange for 41-60 percent, light red for 61-80 percent, and dark red for 81-100 percent. Filters and sorting options for servers, rails, and utilization type are displayed at the top.

GPUサーバーとレールの集約されたトラフィックを表示およびフィルタリングすることもできます。
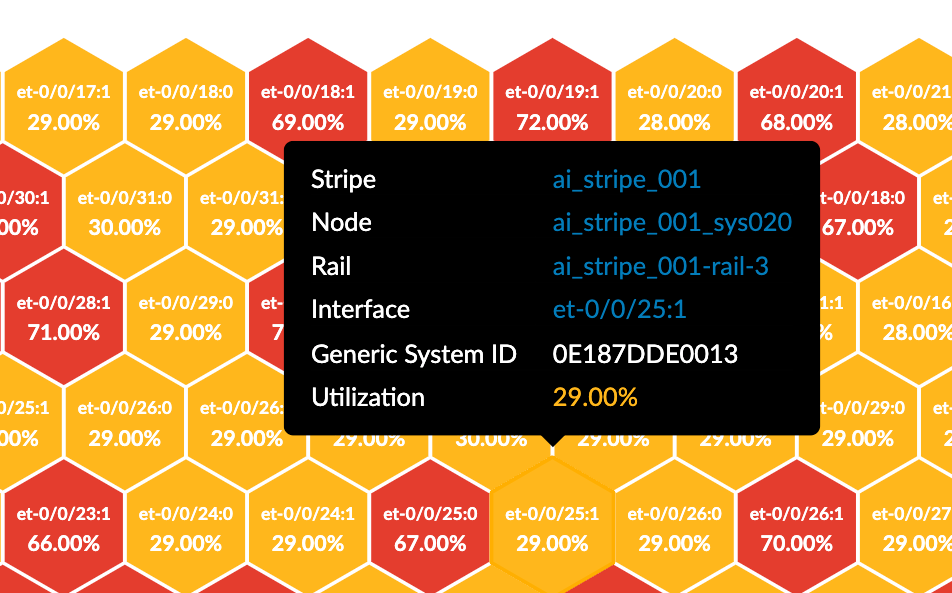
六角形をクリックすると、特定のGPUまたはNICの詳細が表示されます。

Hexagonal grid visualization showing interface utilization metrics with identifiers and percentage values. Colors range from yellow to red, indicating utilization levels. Tooltip displays details for node ai_stripe_001_sys020 including interface et-0/0/25:1 and utilization at 29.00 percent.