例: モニター
このセクションでは、新しい テストエージェントの作成と展開のセクションに従って、テストエージェント(モニターに必要な数)が作成されていることを前提としています。
モニターオーケストレーションの概要
REST API を使用してモニターを作成して開始する前に、「 テストおよびモニターテンプレート」の章で説明されているように、コントロールセンターでモニターのベースとなるテンプレートを定義する必要があります。そのテンプレートで テンプレート入力 として指定されたすべてのパラメーターには、REST API を使用してモニターを作成するときに値を割り当てる必要があります。
モニターの作成
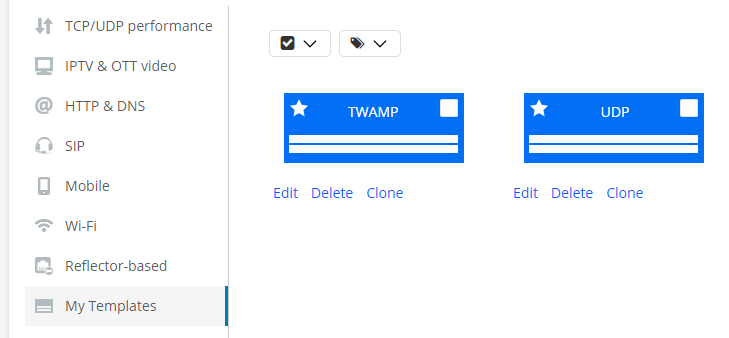
コントロールセンターで、2つのテストエージェントインターフェイス間のUDP監視用のテンプレートと、テストエージェントがTWAMPリフレクタに対するTWAMPイニシエータとして機能するテンプレートの2つ設定されているとします。
以下は、REST APIを介してアカウントのモニターテンプレートを一覧表示するためのPythonコードです。
# Request settings
# NOTE: User is able to pass additional parameters as a query string ?limit=100&offset=111:
# limit: Changes number of elements returned from API
# offset: Changes element from which results will be returned
url = '%s/accounts/%s/monitor_templates/%s' % (args.ncc_url, args.account, args.query_params)

# Get list of monitor templates
response = requests.get(url=url, headers={'API-Token': args.token})
出力は次のようになります (以下では、2 つのモニター テンプレートが定義されています)。
{
  "count": 2,
  "items": [
    {
      "description": "",
      "id": 1,
      "inputs": {
        "clients": {
          "input_type": "interface_list"
        },
        "server": {
          "input_type": "interface"
        }
      },
      "name": "UDP"
    },
    {
      "description": "",
      "id": 2,
      "inputs": {
        "rate": {
          "input_type": "float"
        },
        "reflectors": {
          "input_type": "twamp_reflector_list"
        },
        "senders": {
          "input_type": "interface_list"
        },
        "time_sync": {
          "input_type": "string"
        },
        "time_sync_inband": {
          "input_type": "string"
        }
      },
      "name": "TWAMP"
    }
  ],
  "limit": 10,
  "next": null,
  "offset": 0,
  "previous": null
}
1 つのテンプレートのみを検査する場合は、テンプレートの ID を指定して、次のように実行できます。
# Request settings
url = '%s/accounts/%s/monitor_templates/%s/' % (args.ncc_url, args.account, args.monitor_template_id)  # Template ID specified in last argument

# Get monitor template
response = requests.get(url=url, headers={'API-Token': args.token})
前の例を続けると、このコードを実行すると、次の出力が生成されます。
{
  "description": "",
  "id": 1,
  "inputs": {
    "clients": {
      "input_type": "interface_list"
    },
    "server": {
      "input_type": "interface"
    }
  },
  "name": "UDP"
}
ここで、TWAMP テンプレートに基づいてモニターを作成するとします。これは、モニターの POST 操作を使用して行われます。既定では、この操作の結果としてモニターもすぐに起動します (started 既定値は true です)。または、False に設定 started し、別の操作を使用してモニターを起動することもできます:「 モニターの開始と停止」セクションを参照してください。
下の inputsパラメータには、実行時に定義される値を指定する必要があります。パラメータ名は、コントロールセンターで 変数名 として定義されているものです。ここでは、コントロールセンターの表示名の小文字バージョン(「送信者」と「送信者」など)です。
以下は、モニターに必要なパラメーター設定を提供するコードです。異なる入力セットを持つモニターテンプレートの場合、この手順の詳細はもちろん異なります。
この例では、 モニターにアラーム は関連付けられていません。アラームに関する例については、「 アラーム付きモニタの作成」セクションに進んでください。
# Request settings
url = '%s/accounts/%s/monitors/' % (args.ncc_url, args.account)

# JSON content
json_data = json.dumps({
    'name': 'TWAMP monitor',
    'input_values': {
        'senders': {
            'input_type': 'interface_list',
            'value': [{
                'test_agent_id': 1,
                'interface': 'eth0',
                'ip_version': 4
            }]
        },
        'reflectors': {
            'input_type': 'twamp_reflector_list',
            'value': [1]
        },
        'rate': {
            'input_type': 'float',
            'value': 1.0
        },
        'time_sync': {
            'input_type': 'string',
            'value': '0'
        }
    },
    'started': True,  # Set this to False in order not to start the monitor
    'template_id': 1  # Reference to monitor template
})

# Create monitor
response = requests.post(url=url, data=json_data, headers={
    'API-Token': args.token,
    'Accept': 'application/json; indent=4',
    'Content-Type': 'application/json',
})
入力値に関する senders いくつかのコメントは、入力がどのように構造化されているかを説明するのに役立ちます。
この入力値には input_type = interface_listがあるため、その中で value テストエージェントインターフェイスのリストを指定する必要があります。上記の例では、2つのインターフェイスのリストが渡されています。インターフェイスごとに、使用するテストエージェントID、テストエージェントインターフェイス、およびIPバージョンを指定する必要があります。
IPv6は特定のタスクタイプ(サポートドキュメントで詳しく説明されている)でのみサポートされているため ip_version 、= 6はそれらのタスクに対してのみ有効な設定であることに注意してください。
アラーム付きモニターの作成
アラームをモニタに関連付けるには、定義済みのアラーム テンプレートをポイントするか、POST 操作でアラーム設定全体を指定します。以下に、各アプローチの1つの例を示します。
アラームテンプレートのポイントによるモニターアラームの設定
アラームテンプレートを使用するには、その ID を知っている必要があります。そのためには、まず「 すべてのアラームテンプレートの取得」 セクションの説明に従ってすべてのアラームテンプレートを取得し、 id 関連するテンプレートの値をメモします。この ID が "3" であるとします。その後、そのテンプレートを次のように参照できます。
# Request settings
url = '%s/accounts/%s/monitors/' % (args.ncc_url, args.account)

# JSON content
json_data = json.dumps({
    'name': 'Monitor from template with alarm template',
    'input_values': {
前の例と同様に、ここでモニターの入力値を指定します。
    'started': True,         # Set this to False in order not to start the monitor
    'template_id': 1,        # Reference to _monitor_ template
    'alarm_configs': [{
        'template': 2,       # Reference to _test_ template
(ここでは、一部の省略可能なパラメーターは省略されています)。
    }]
})

# Create monitor
response = requests.post(url=url, data=json_data, headers={
    'API-Token': args.token,
    'Accept': 'application/json; indent=4',
    'Content-Type': 'application/json',
})
直接設定することによるモニターアラームの設定
または、モニターの作成時にアラームテンプレートを参照せずに設定全体を指定することで、モニターのアラームを設定できます。これは、次の例に示すように行われます。
# Request settings
url = '%s/accounts/%s/monitors/' % (args.ncc_url, args.account)

# JSON content
json_data = json.dumps({
    'name': 'Monitor from template with alarm config.',
    'input_values': {
ここでモニターの入力値を指定します。
    },
    'template_id': 1,
    'alarm_configs': [{
        'email': 1,
        'snmp': 1,
        'thr_es_critical': 7,
        'thr_es_critical_clear': 6,
        'thr_es_major': 5,
        'thr_es_major_clear': 4,
        'thr_es_minor': 3,
        'thr_es_minor_clear': 2,
        'thr_es_warning': 1,
        'thr_es_warning_clear': 0,
        'window_size': 60,
        'interval': 3600,
        'action': 'Action text',
        'send_only_once': False,
        'no_data_timeout': 1800,
        'snmp_trap_per_stream': False,
        'no_data_severity': 1  # CLEAR = 0 | WARNING = 1 | MINOR = 2 | MAJOR = 3 | CRITICAL = 4
    }]
})

# Create monitor
response = requests.post(url=url, data=json_data, headers={
    'API-Token': args.token,
    'Accept': 'application/json; indent=4',
    'Content-Type': 'application/json',
})
モニターの開始と停止
モニターが作成時に開始するように構成されていない場合 (started False に設定)、PUT または PATCH 操作を適用して開始する必要があります (2 つの操作は同等です)。以下に、PATCH 操作を示します。
# Parameter settings for monitor
json_data = json.dumps({
    "started": True
}

# Request settings
url = '%s/accounts/%s/monitors/%s/' % (args.ncc_url, args.account, args.monitor_id)

# Start monitor
response = requests.patch(url=url, headers={'API-Token': args.token})
モニターが起動します。
モニターを停止するには、同じ操作を使用しますが started 、False に設定します。
# Parameter settings for monitor
json_data = json.dumps({
    "started": False
}
モニターのSLAステータスとデータメトリックの取得
モニターのSLAステータスと包括的なデータメトリックを取得する方法は次のとおりです。この操作では、モニターの完全な構成もフェッチされます。
既定では、SLA 状態は、過去 15 分、過去 1 時間、および過去 24 時間の時間間隔ごとに返されます。URL の末尾にあるクエリ文字列に および start end パラメーターを含めることで、既定の間隔を置き換えて別の時間間隔を指定できます。時刻は IETF RFC 3339 で規定されているとおり、UTC (ISO 8601) で指定されます。以下に例を示します。
この操作では、モニターによって実行された各タスクの詳細なデータメトリクスを返すこともできます。この機能を有効にするには、true に設定します with_detailed_metrics (既定では、このフラグは false に設定されます)。詳細なデータメトリックは>>metricsの下にtasksあり、 streams パラメータによってresolution長さが決定される連続する時間間隔で与えられます。デフォルトの最大解像度は 10 秒です。入力した解像度の値は、使用可能な解像度(10 秒、1 分、5 分、20 分、または 4 時間)のいずれかに変換されます。
平均メトリクスはデフォルトで返されます。これらをオフにするには、クエリ文字列で false に設定しますwith_metrics_avg。平均メトリックはデフォルトで過去 15 分間に計算されtasks、 > streams > metrics_avgに表示されます。と endでstart別の時間間隔を指定すると、代わりにその間隔の平均メトリックが返されます。
出力には、モニター・ログも含まれます。
例(詳細なデータメトリックのデフォルトの解像度は10秒):
# Detailed metrics
with_detailed_metrics = 'true'

# Request settings
url = '%s/accounts/%s/monitors/%s/?with_detailed_metrics=%s' % (args.ncc_url, args.account, args.monitor_id, with_detailed_metrics)

# Get monitor
response = requests.get(url=url, headers={'API-Token': TOKEN})
出力は次のようになります。
{
  "description": "This is a multisession TCP monitor",
  "gui_url": "https://localhost/dev/monitoring/11/?start=1507127679&end=1507128579",
  "id": 18,
  "last_15_minutes": {
    "end_time": "2017-10-04T14:49:39",
    "sla": 99.67,
    "sla_status": "acceptable",
    "start_time": "2017-10-04T14:34:39"
  },
  "last_24_hours": {
    "end_time": "2017-10-04T14:49:39",
    "sla": 99.98,
    "sla_status": "good",
    "start_time": "2017-10-03T14:49:39"
  },
  "last_hour": {
    "end_time": "2017-10-04T14:49:39",
    "sla": 99.86,
    "sla_status": "acceptable",
    "start_time": "2017-10-04T13:49:39"
  },
  "name": "MultiTCPMonitor",
  "report_url": "https://localhost/dev/monitoring/11/report_builder/?start=1507127679&end=1507128579",
  "started": true,
  "tags": [],
  "tasks": [
    {
      "name": "MultiTCP",
      "task_type": "multitcp",
      "config": {
        "acceptable_sla": 99.5,
        "client": {
          "ip_version": 4,
          "name": "eth1",
          "preferred_ip": null,
          "test_agent": 2
      },
      "connections": 100,
      "delay": 0,
      "direction": "down",
      "down_es_connected": 10,
      "down_es_rate": 0.2,
      "down_es_max_rate": 0.2,
      "good_sla": 99.95,
      "port": 5000,
      "server": {
        "ip_version": 4,
        "name": "eth1",
        "preferred_ip": null,
        "test_agent": 1
      },
      "up_es_connected": 10,
      "up_es_rate": 0.2,
      "up_es_max_rate": 0.2
    }
  ]
  "streams": [
    {
      "direction": "down",
      "gui_url": "https://localhost/dev/results/27/rrd_graph/?start=1507127679&end=1507128579",
      "id": 27,
      "is_owner": true,
      "metrics": [
        [
          "2017-10-04T13:34:39",
          "2017-10-04T13:34:49",
          "10",
          ... (remaining metrics omitted here)
        ]
        [
          ... (metrics for next 10 second interval)
        ]
        ... (further batches of metrics for successive 10 second intervals)
      ]
      "metrics_avg": {
        "start_time": "2017-10-04T14:34:39",
        "end_time": "2017-10-04T14:49:39",
        "active": 10,
        "connected": 10,
        "disconnected": 0,
        "es": 0.33,
        "es_connected": 0.33,
        "es_rate": 0.00,
        "rate": 12.49,
        "sla": 99.67,
        "sla_status": "acceptable"
      },
      "metrics_headers": [
        "start_time",
        "end_time",
        ... (rest omitted)
      ]
      "metrics_headers_display": [
        "Start time",
        "End time",
        ... (rest omitted)
      ]
      "name": "VTA1:eth1 (IPv4) (server) -> VTA2:eth1 (IPv4) (client)"
    }
  ],
  "last_3_logs": [
    {
      "level": "warning",
      "message": "Monitoring log message"
    }
  ]
}
クエリ文字列で "開始" 時間と "終了" 時間、および詳細データ メトリックの時間分解能を指定する方法を次に示します。
# Custom time interval
start = '2017-10-04T12:00:00.000000Z'
end = '2017-10-04T12:30:00.000000Z'

# Detailed metrics
with_detailed_metrics = 'true'

# Time resolution of metrics
resolution = '60'

# Request settings
url = '%s/accounts/%s/monitors/%s/?start=%s&end=%s&with_detailed_metrics=%s&resolution=%s' % (args.ncc_url, args.account, args.monitor_id, start, end, with_detailed_metrics, resolution)
すべてのモニターとそのSLAを一度に取得することもできます。ただし、この場合、詳細なデータ メトリックはエクスポートに含まれません (>streams項目はtasks省略されます)。これは、モニターの数が多い場合に出力のサイズを制限するためです。
# Request settings
url = '%s/accounts/%s/monitors/' % (args.ncc_url, args.account)

# Get monitor and its SLA
response = requests.get(url=url, headers={'API-Token': args.token})
モニターでの PDF レポートの生成
モニター上の PDF レポートは、REST API から直接生成できます。レポートの形式は、コントロール・センター GUI から生成される形式と同じです。
既定では、レポートは過去 15 分間をカバーします。URL の末尾にあるクエリ文字列に および start end パラメーターを含めることで、別の時間間隔を指定できます。時刻は IETF RFC 3339 で規定されているとおり、UTC (ISO 8601) で指定されます。
さらに、次のオプションをクエリ文字列に含めることができます。
worst_num:モニター内のタスクごとに、表示する測定結果の数を、最悪のものを一番上に含むエラー秒数でランク付けして指定できます。測定結果の範囲はタスクに依存します。一例を挙げると、HTTPの場合、1つのクライアントで得られた結果です。デフォルトの数は 30 です。graphs: レポートにグラフを含めます。
例:
# Include graphs
graphs = 'true'

# Request settings
url = '%s/accounts/%s/monitors/%s/pdf_report?graphs=%s' % (args.ncc_url, args.account, args.monitor_id, graphs)

# Get monitor
response = requests.get(url=url, headers={'API-Token': args.token})

print 'Status code: %s' % response.status_code
print json.dumps(response.json(), indent=4)