IPsec VPN Monitoring Overview
You can view the status of IPsec VPNs and their tunnels between device endpoints after configuring, publishing, and updating them in Security Director. The status is displayed in dashboard and tabular format. The number of tunnels for each VPN depends on the type of VPN. You can view the tunnel status of IPsec VPNs configured on devices that are managed by Security Director.
Starting in Junos Space Security Director Release 20.3, you can monitor the status of remote VPNs.
Security Director cannot monitor the tunnel status if the VPN is configured between a Juniper and a non-Juniper (extranet) device.
IPsec VPN monitoring micro-service runs at specified intervals and updates the status of the IPsec VPN tunnel as up or down. It polls log collector data every 5 minutes by default and SRX Series device every 6 hours.
The following configuration should be done to send all the logs including KMD logs to Security Director log collector:
set system syslog host <IP> any any
set system syslog host <IP> structured-data
Here, IP is the log collector IP and any any means all the system logs will be sent to Security Director Log Collector.
Figure 1 shows the overview page. It displays the dashboards for monitoring current VPNs, its tunnels, and historical tunnel status pattern in the past.
In the Monitored Tunnels dashboard, you can view the total number of IPsec VPN tunnels and the number of tunnels that are up and down. Each block is a tunnel and is sorted by both modified date and created date. Modified tunnels appears first followed by created tunnels. You can hover over each block to view the tunnel endpoints, status, when the tunnel was created and modified, and the IP addresses of the devices. If the status is down, then a reason is also displayed.
In the VPNs Overview dashboard, you can view the number of IPsec VPNs and their status. Hover over the chart to view the status as up or down.
In the No. of Monitored Tunnels Flipped Up/Down dashboard, you can select a duration from the period drop-down list to view the tunnel status pattern in the past. Based on the selected duration, a time range and graph are displayed with the tunnel status data. Hover over the graph to view the number of tunnels and its status during a particular time slot.
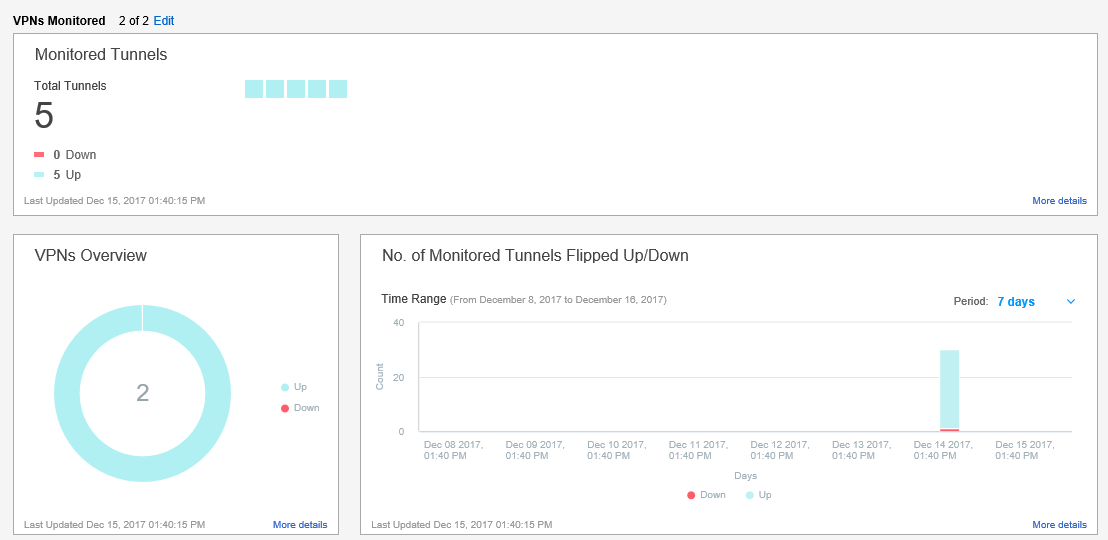
Figure 2 shows the Monitored Tunnels page. It displays tunnel statistics in tabular format. It shows the IPsec VPNs and displays their tunnel status as up, down, or unknown. A reason is provided only for tunnels with a down status. You also see devices and their endpoints.
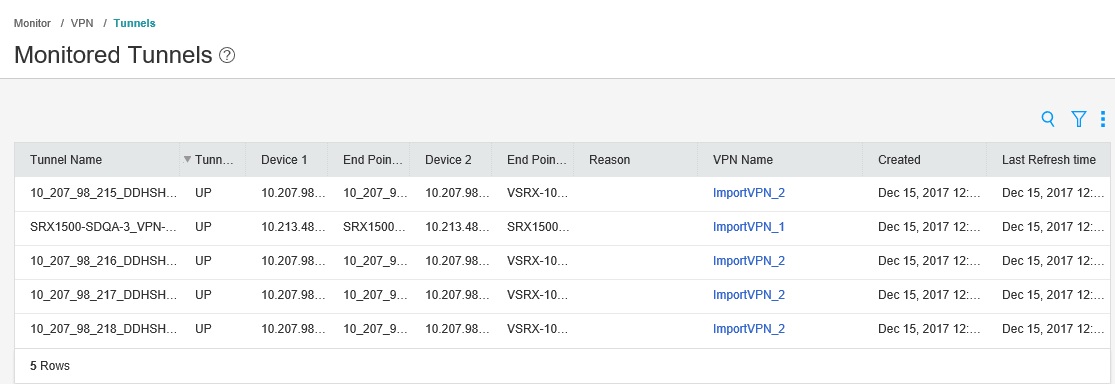
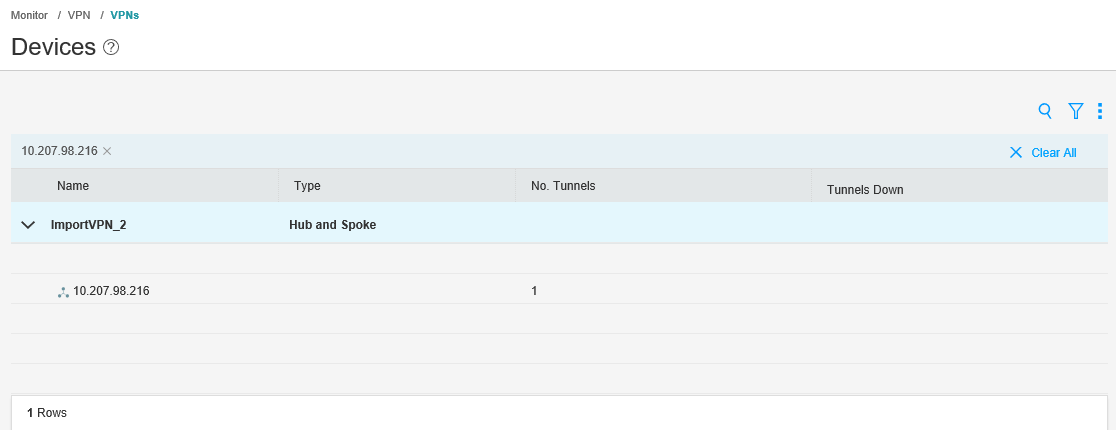
Figure 3 shows the Devices page. It displays IPsec VPN statistics in tabular format. It shows all the VPNs and their types, all the devices in a VPN, total number of tunnels, and the number of tunnels that are down.
In previous releases of Security Director, network administrators had to analyze the VPN logs on an SRX Series device to check the status of VPNs and their tunnels. It required administrators to have expertise in parsing VPN logs to get the information they needed. Network Administrators can now view the IPsec VPN and its tunnel status directly in Security Director. A reason is displayed in the Security Director user interface when a tunnel is down.