监控瞻博网络安全连接并排除故障
本主题包含有关使用瞻博网络安全连接进行 VPN 监控和故障排除问题的信息。
要监控 VPN 连接,请使用 J-Web 界面,如 监控 VPN 连接中所述。
如果您在使用瞻博网络安全连接应用时遇到任何问题,建议您按照以下步骤检查日志消息并找到问题:
监控您的 VPN 连接
您可以使用 J-Web 界面监控现有的远程访问 VPN 连接。为此,请导航到 “监控>网络> IPsec VPN ”页面。 图 1 显示了监控菜单选项下的示例 IPsec VPN 页面。
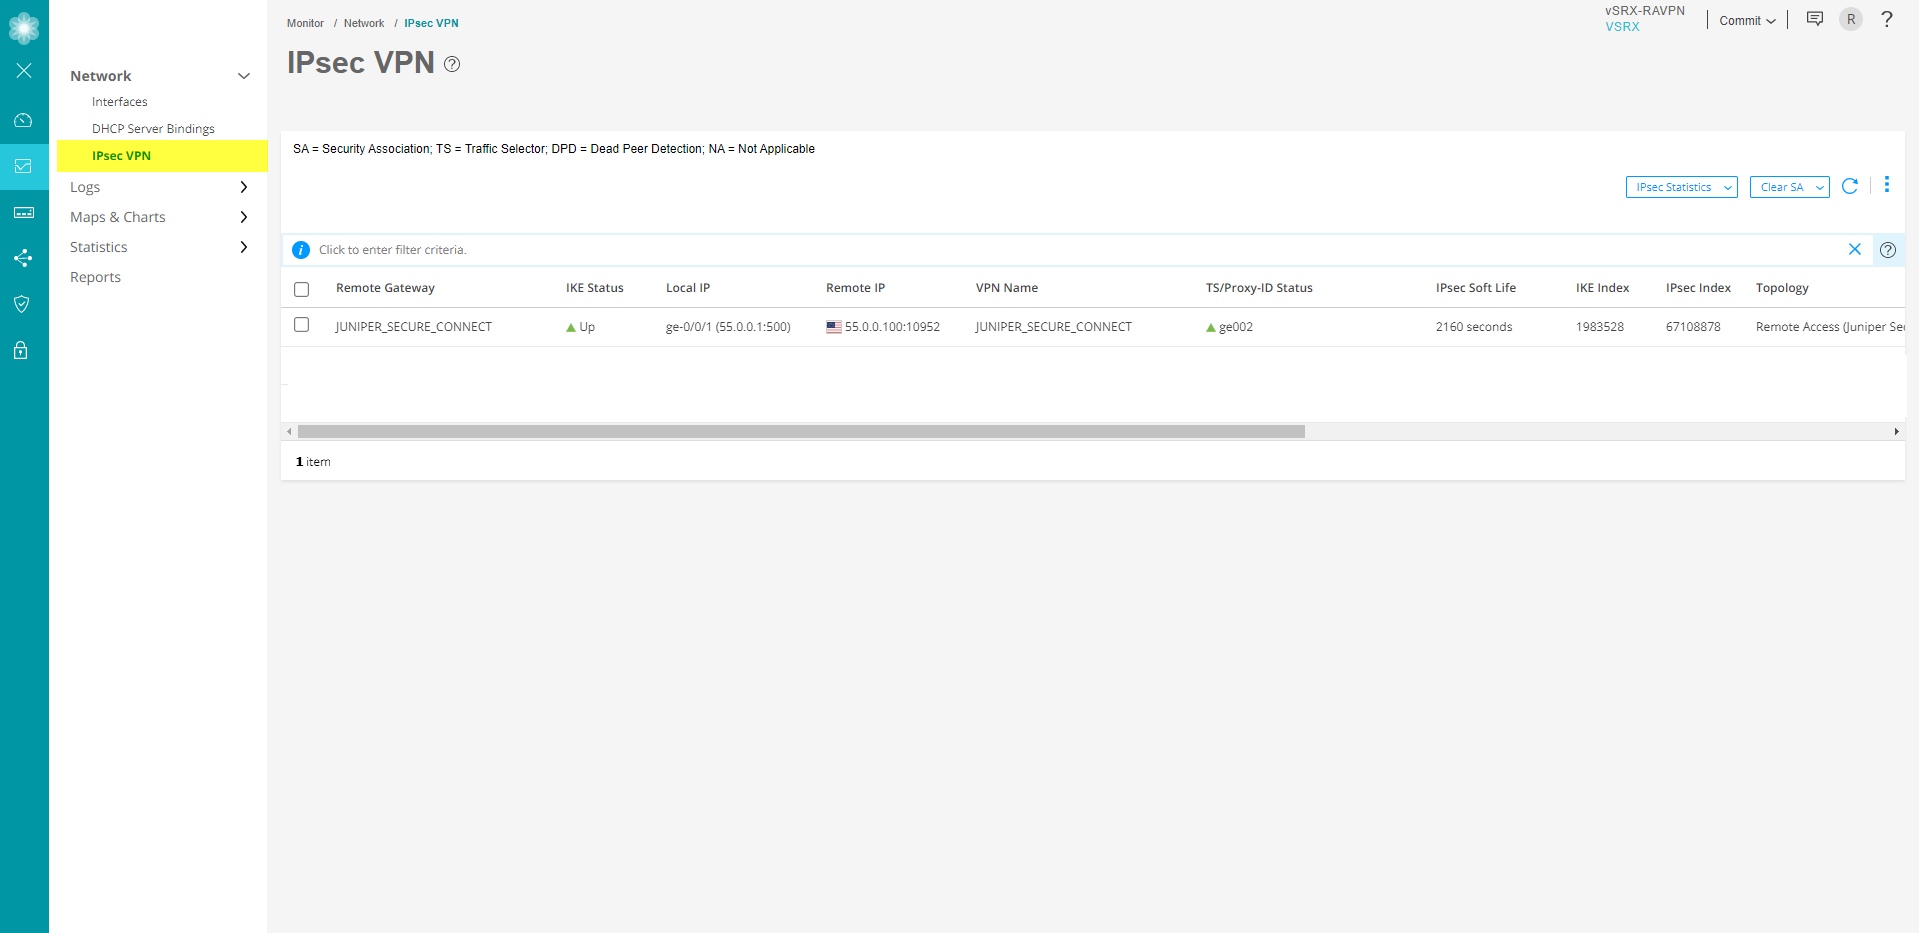
IPsec VPN 页面显示 IKE/IPsec 配置、安全关联 (SA) 和 IPsec 统计信息。
有关详细信息,请参阅 监控 IPsec VPN 。
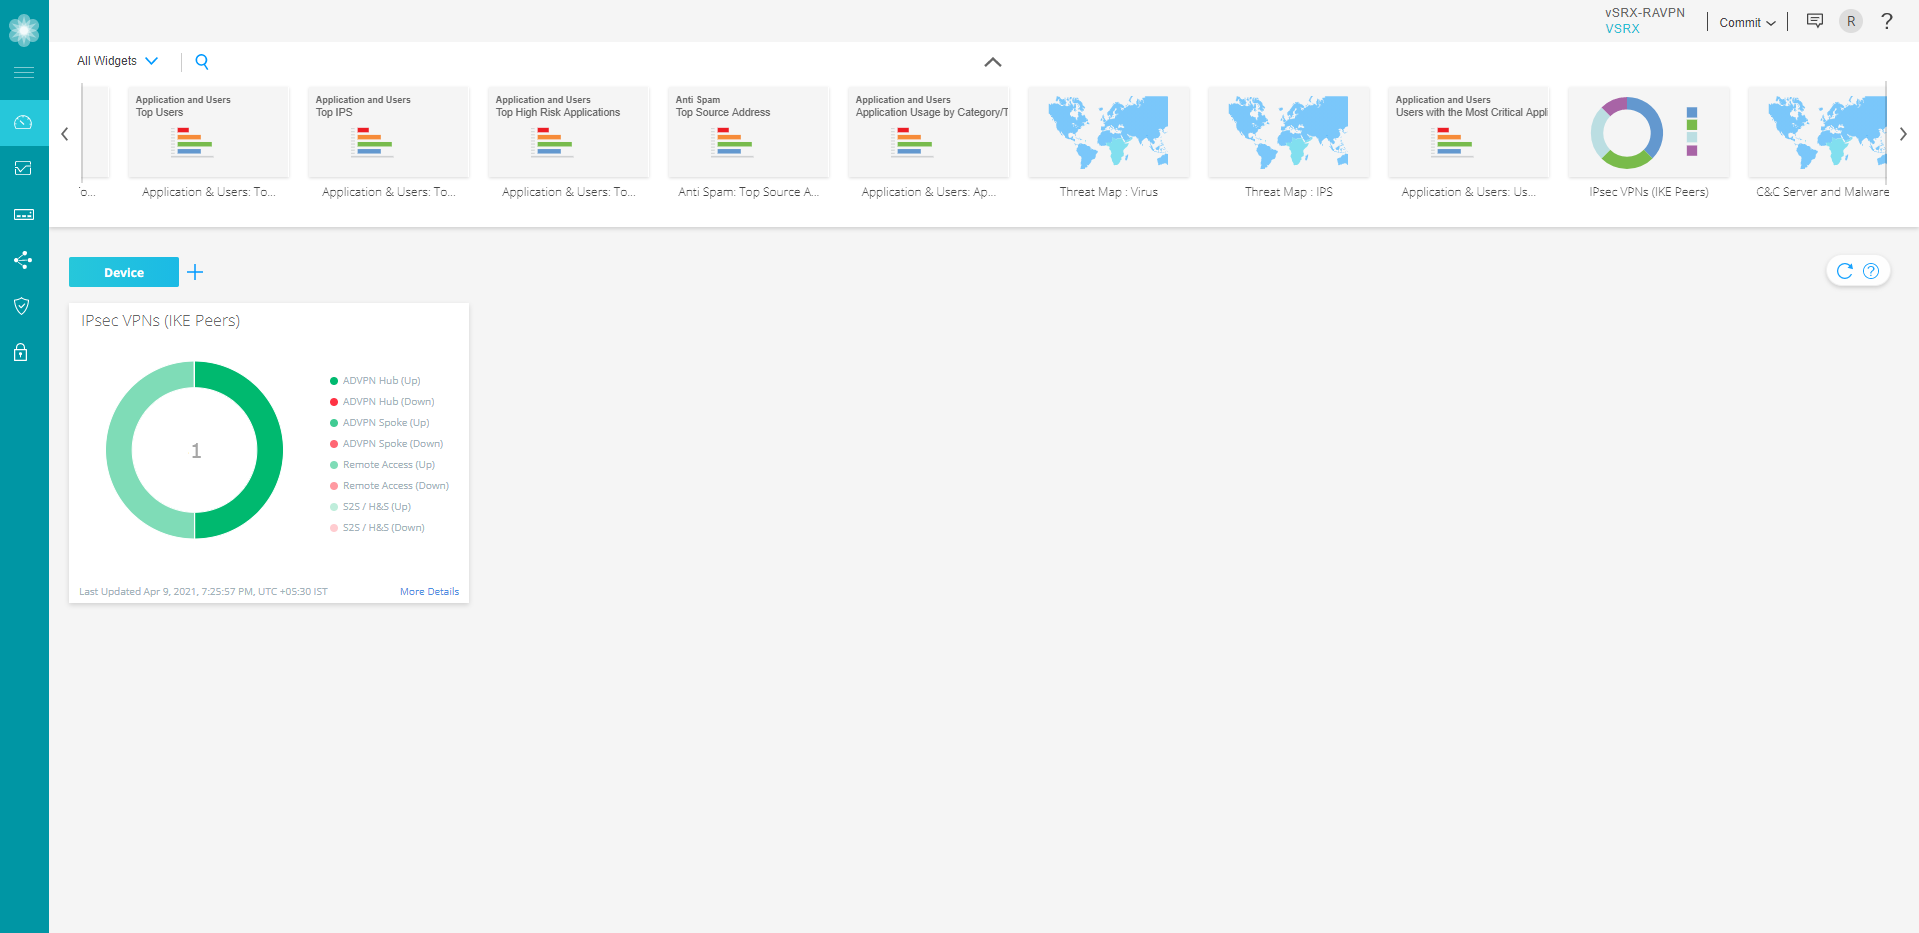
您还可以查看 J-Web 仪表板,了解 IKE 对等方的状态和计数,如 图 2 所示。将鼠标悬停在小组件中的部分上,以查看 VPN 拓扑类型的 IKE 对等方计数。请参 阅 仪表板概述 。
检查 Junos OS 日志
您必须配置 syslog 才能将 syslog 文件保存在设备上。J-Web 目前不支持结构化日志。仅支持非结构化日志。
要在 J-Web 界面中查看系统日志,请导航到 设备管理>作>文件 ,如下所示:
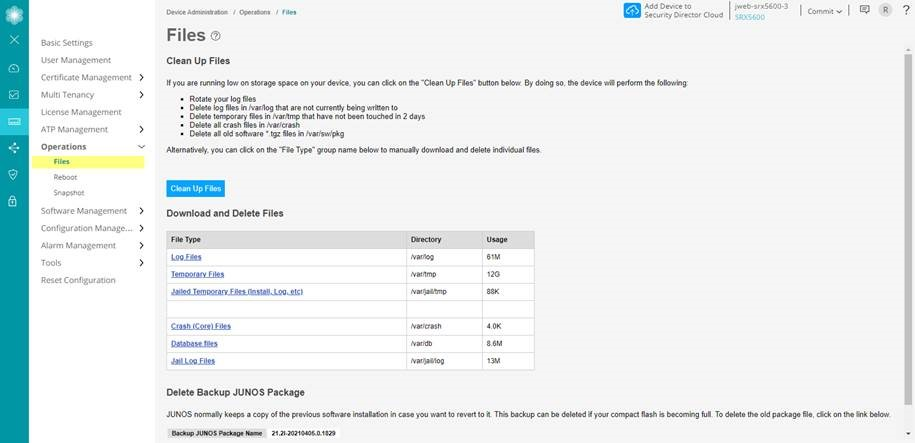
默认日志文件和追踪选项会在 /var/log 文件夹下自动创建。
您可以导航到 Monitor > Events > IPsec VPN 页面来查看流(流量或路由引擎)日志。
检查瞻博网络安全连接应用日志
窗户
以下是检查 Windows 设备上的瞻博网络安全连接应用程序日志的步骤:
日志在后台持续处于活动状态,即使日志窗口未打开也是如此。所有相关的瞻博网络安全连接通信事件都会显示在一个日志文件中,并在每个作日保存一周。超过七在线天的文件将被自动删除。
通信过程完成后,日志文件将在 Log 文件夹下的安装目录中自动生成。日志文件以 NCPyymmdd.LOG 格式命名,其中 yy=year,mm=month 和 dd=date。选择 “帮助>日志” 以查看日志簿页面中的日志消息。
您可以使用 “扩展日志设置 ”选项更改日志文件的存储时间。您可以使用文本编辑器打开和分析日志文件。
图 4:日志菜单选项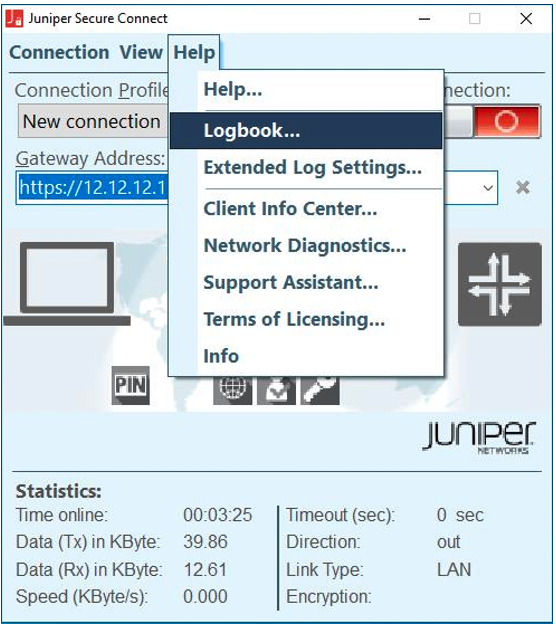 图 5:日志消息显示
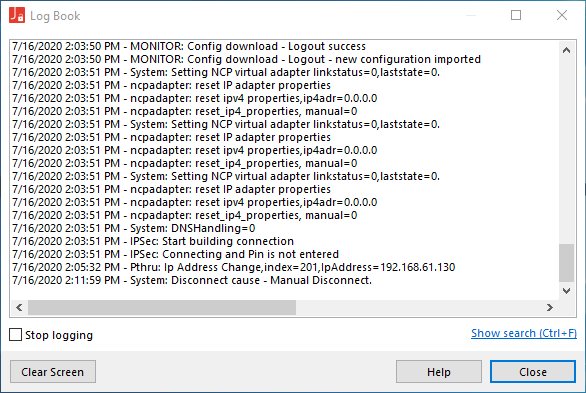
在菜单栏中,单击 “帮助 ”,然后选择 “扩展日志设置”。
图 6:扩展日志设置菜单选项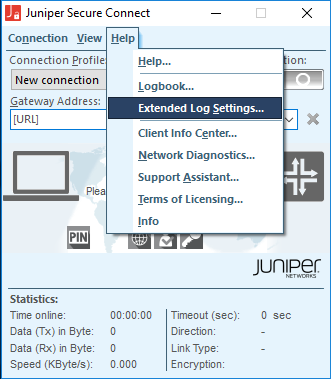
通过选中所有复选框启用所有选项,然后单击 “确定”。
图 7:扩展日志设置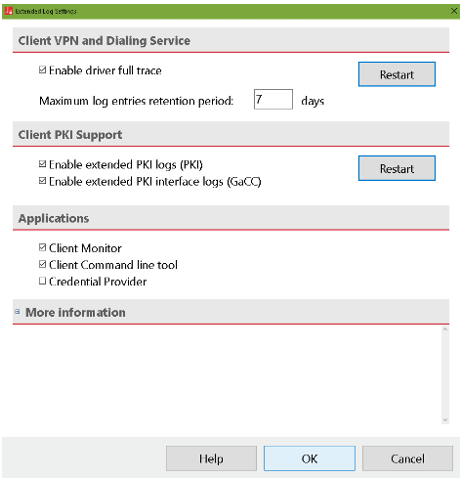
打开日志簿并检查是否有任何指示问题的日志消息。如果无法根据日志消息解决问题,请单击“ 帮助 ”,然后选择 “支持助手”,以启动支持助手。支持助手收集所有必需的数据。
图 8:支持助手菜单选项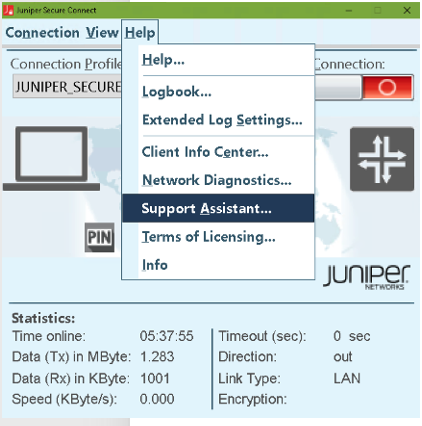
单击 “添加 ”以附加任何其他文件,然后单击 “下一步”。此时将打开“ 保存存档文件 ”页面。
图 9:保存存档文件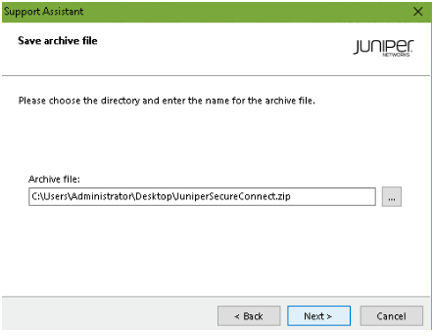 图 10:日志文件列表
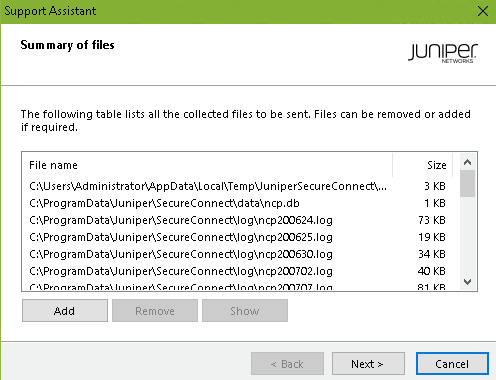
选择“ 仅创建存档文件 ”选项按钮。然后,单击 “下一步”。
图 11:仅创建存档文件
存档过程完成后,瞻博网络安全连接将显示存档文件的位置。
图 12:成功创建日志文件存档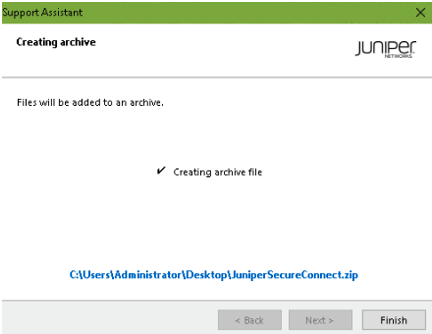
单击 Finish。
macOS
通过瞻博网络安全连接应用程序菜单选择 “日志”>“日志” 以打开日志。
图 13:日志菜单选项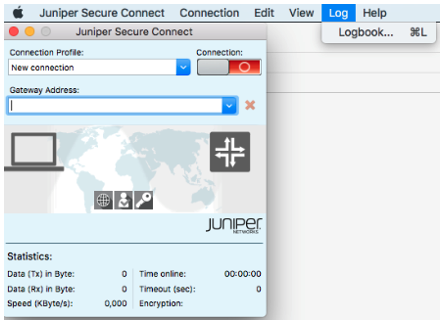
检查是否有任何指示问题的日志消息。
图 14:显示日志信息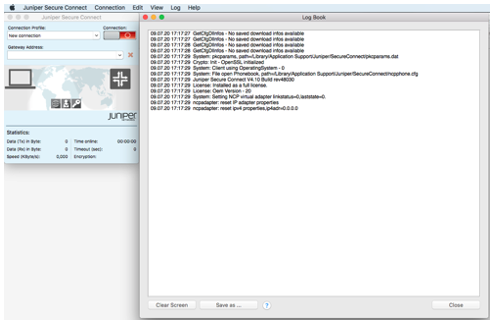
如果无法解决此问题,请将此日志消息保存到文件名 为 ncpmonlog.txt 的文件中。将文件 ncpphone.cfg 复制到保存日志文件 /Library/Application Support/Juniper/SecureConnect/ncpphone.cfg 的同一位置。
要找到 ncpphone.cfg 文件,请打开 Finder 并在菜单栏中选择 Go ,同时按下键盘上的“Option”键。
图 15:打开文件库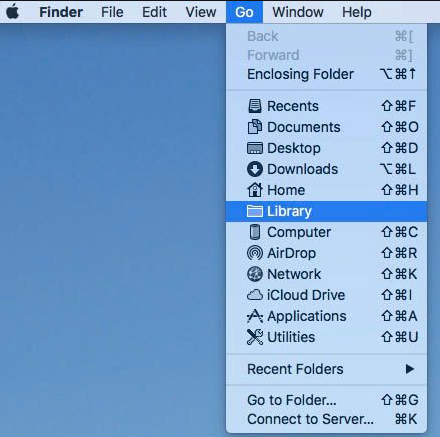
将显示保存瞻博网络安全连接文件的目录位置。
图 16:瞻博网络安全连接目录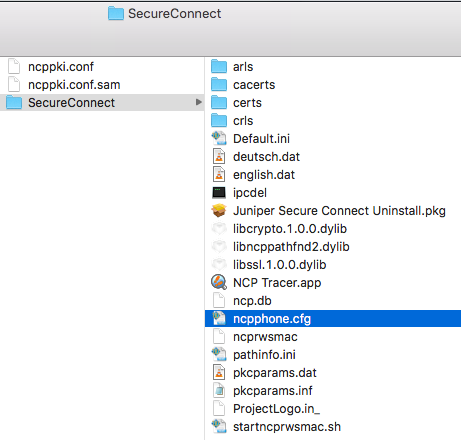
人造人
以下是检查 Android 设备上的瞻博网络安全连接应用日志的步骤:
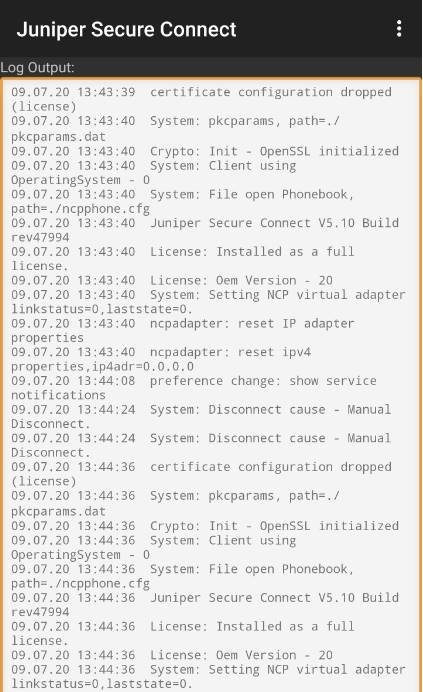
在瞻博网络安全连接应用菜单中,单击右上角的三个垂直点,然后从菜单中选择 日志 。
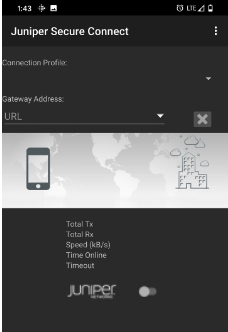
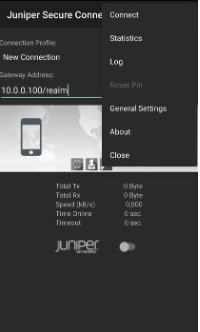
此时将显示日志输出窗口,其中显示日志消息。
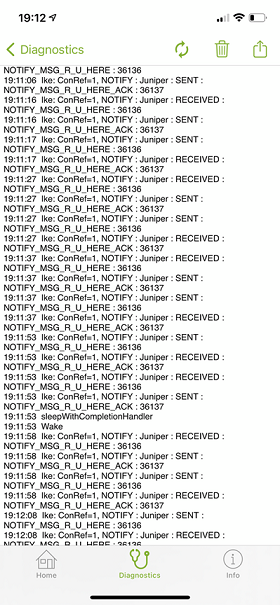
iOS系统
日志在后台持续处于活动状态,即使日志窗口已关闭也是如此。所有相关的瞻博网络安全连接通信事件都保存在日志文件中。导航到“诊断 ”>“调试>错误日志 ”以查看日志消息。单击屏幕顶部的导出图标,通过提供的应用程序发送日志文件。