Marvis 查询语言
开始使用 Marvis 查询语言来构建从 Marvis 提取数据的查询。
Marvis 查询语言提供了一个结构化框架,用于查询 Marvis 以获取有助于您监控网络或进行网络故障排除的数据。您可以使用查询快速查找有关网络中的事件或故障以及受影响设备的详细信息。
视频演示
In today's product highlights, we are going to cover the query language aspect of Marvis. With a query language, what you get is a structured format of asking a query which will result in the raw or the tabular data. This is very powerful when you want to quickly find out if a certain event or a certain type of failure is actually occurring in your environment and which all devices are impacted by that.
There are additionally other features as well which we can go through which take us beyond the simple aspect of searching for a certain event and seeing the impact. So, let's get started. The one I'm going to walk through today and go through is the list query.
So, I simply select the option from the drop down, hit my spacebar key and go through the different options. In our case, I'll go through list client events with, I'll go for an event type. Say we're interested in DHCP and we're looking for DHCP failures.
So, let's take DHCP denied and we want to see it for a certain WLAN and this is the only place in the system which you can filter out based on WLAN. So, I'm going to search on my WLAN call live demo and see what the results are. So, right away we can see there are 56 such events where the DHCP was denied but all the pertinent information with respect to which client, what's the one who called that event, the WLAN we already specified, it's the WLAN live demo do not remove, the IP address it had before or what it was trying, the AP in terms of the BSSID, protocol, band, channel, so on and so forth.
You can definitely drill deeper into each event if you click on this option here and see that this indeed was a DHCP negative acknowledgement, usually seen when the client is trying to ask for an IP address which is already in use or which is not in that subnet. Additionally, you can also download this entire list so that you can take it offline and then slice and dice it based on your requirements. The next piece I'll go through is with respect to the AP, so I'll clear this out and we'll go back to list.
This time I'll do AP events with AP event type and one of the most popular ones we know about and we know you care about is APs which are disconnected and that's the one we'll focus on today. So right here we can see these are the, this is the only AP which is disconnected but of course you may want to look at it on a more historical time window and again this is the only place in the system where not only till seven days, you can also go as far as 30 days worth of data since it's the raw data, be able to present it to you for a longer time window to see what all went through during that time period. For our purpose today, I'll just select seven days since most of the times that's a good window to look at for APs which are disconnected with all the required information of what the AP is, what site it was at, so on and so forth.
Let's move on to the next use cases of listing and in our case, I'll go for listing switch events. Again, this is the net new feature in addition to the Wi-Fi based event querying where you can now get to listing Juniper EX switch events with respect to whatever is of interest to you. In my case, we'll say with switch event type and I want to take a look at if there were any significant STP topology changes in my environment during the last seven days.
Here you can see these are the switches which had their STP topology changed and as discussed earlier, more details about which the root ID was, what was the root cost, the port, so on and so forth. This is one such way you can use query language. Again, we went through the list query looking at the client's access point switches for different event types.
I highly recommend you go through the other list query options and see what all may be of use to you further. Additionally, there are other query options as well such as listing the count of certain entities, ranking them. The one I'm going to focus on and which is of supreme importance especially in troubleshooting is the roaming off query.
So, I'm going to select roaming off. I can continue using the same site called live demo or you can select any other site of your choice and I'm going to pick a sample client such as one of these iPhones here and look at its roaming behavior during the last seven days. So, right away we can see here all the APs this client was connected to and then the client's experience in terms of roaming.
Now, why this is crucial is for a number of reasons. One, you get the complete picture of where all the client has been especially during the trouble ticket time window and also Marvis highlights and tells you if the roaming was good or bad and if it was bad, what was the reason it was bad as well. For instance, let's take this one case here where we do see overall the roaming looks good but let's zoom in into this time window and see what may have happened.
As an example, we can see here this client was majorly on this EBC AP and for all purposes its connection was good until it decided to go to this test bed AP where we can see clearly Marvis highlighting it's a bad room because the RSSI significantly dropped. Similarly, the client had changed the WLAN or also changed the band. Marvis highlights it for you so that you don't have to hunt and peck to figure out that was the root cause of the client experiencing an issue during that time window.
Additionally, for different views of how the client roamed, we have the floor plan view. As the name suggests, this walks us through where all the client has been so that we understand if a client did make the correct roaming decision or was it sticking on an older access point or did it indeed skip access points when it was transisting through that site. In this case, you can see it started from the GSW AP, pretty much makes its way to other APs which are in line with its path until we get to the AP where we do see the issue and you can see here is where Marvis had flagged the issue and if you look at the AP before it, this AP was far away from the current AP where it had a poor experience.
So that does give you insights into how the client experienced roaming or how the client roamed. As we know, roaming is a client decision which AP to connect to, when to connect to are all client-based decisions. In this case, we can see Marvis highlighted this since the RSSI drop was significant when it moved to this IDF AP.
And finally, for the raw data analysis, we do provide the tabular view where apart from it being downloadable, you can also go through the entire journey in terms of the metrics of the client, everything to do with if it changed the WLAN, the band, and also the old and new RSSI with respect to the different access points so that you can directly pinpoint as to the time window when the trouble came in and what the experience was for the client when it roamed.
Marvis 查询语言结构
查询可以包含下面列出的元素。选择每个元素后使用空格键查看下一个可用选项。
-
查询类型 - 定义您希望 Marvis 执行的作(例如,COUNT、LIST、RANK、LOCATE 或 TROUBLESHOOT)。
-
值 - 指定特定于组织的唯一值,例如客户端的名称。
-
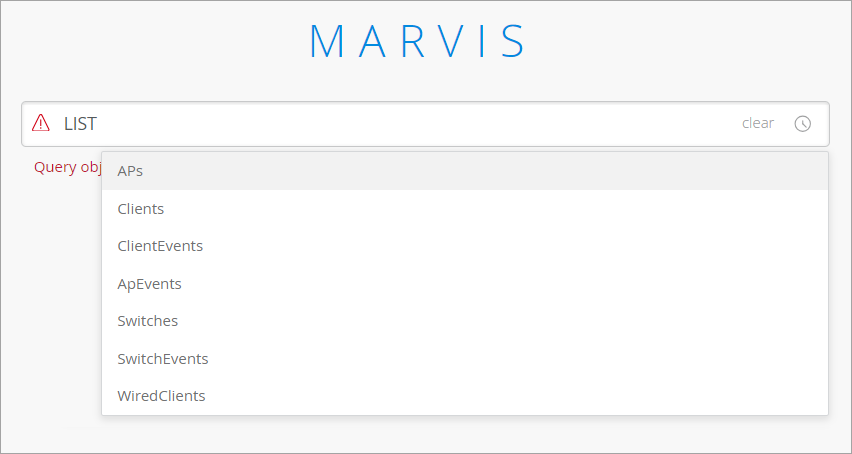
查询对象 (Query Object) - 表示Mist定义的对象(例如,APEvents、ClientEvents)
-
子句 - 用作整个查询的限定符(例如,of、with 或 by)。
-
过滤器类型 (Filter Type) - 根据预定义的过滤器类型缩小结果范围。
您还可以在 Marvis 查询结束时添加持续时间,并以 CSV 格式下载结果和查询字符串。
查找 Marvis 查询页面
从左侧菜单中选择 Marvis > Marvis作 。然后单击页面右上角的 “提问 ”按钮。
输入结构化查询
Marvis 将指导您逐步在查询中输入所需的元素。
若要开始,请单击 “输入查询 ”文本框。然后单击下拉菜单中的选项之一。
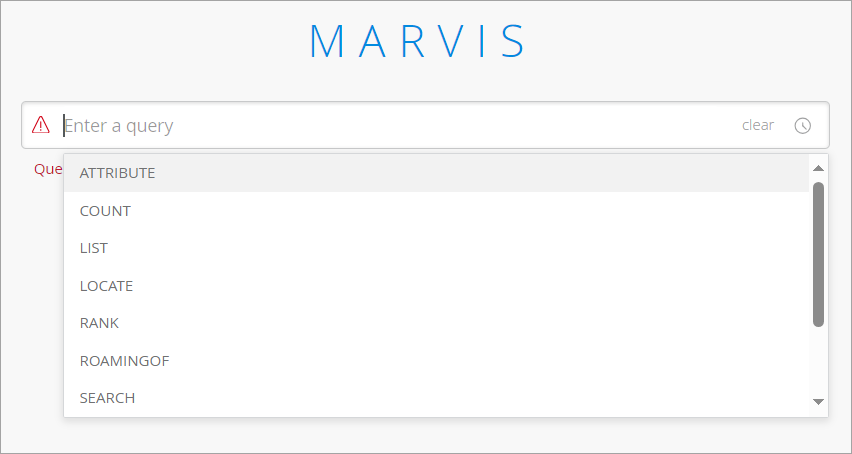
单击某个选项后,该选项将显示在查询框中。按空格键,Marvis 将显示可用选项。下面是 LIST 查询类型选项的示例。
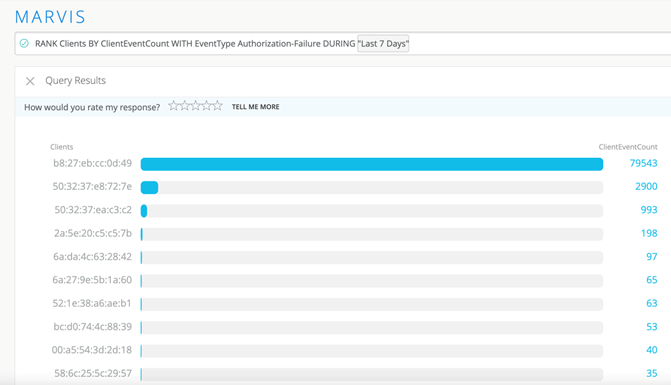
继续按空格键并选择选项,直到输入完整的查询。下面是一个 RANK 查询示例,该查询根据身份验证失败对客户端进行排名:
下面是一个 LIST 查询示例,该查询列出了以太网端口速度为每秒 1000 兆比特 (Mbps) 的接入点。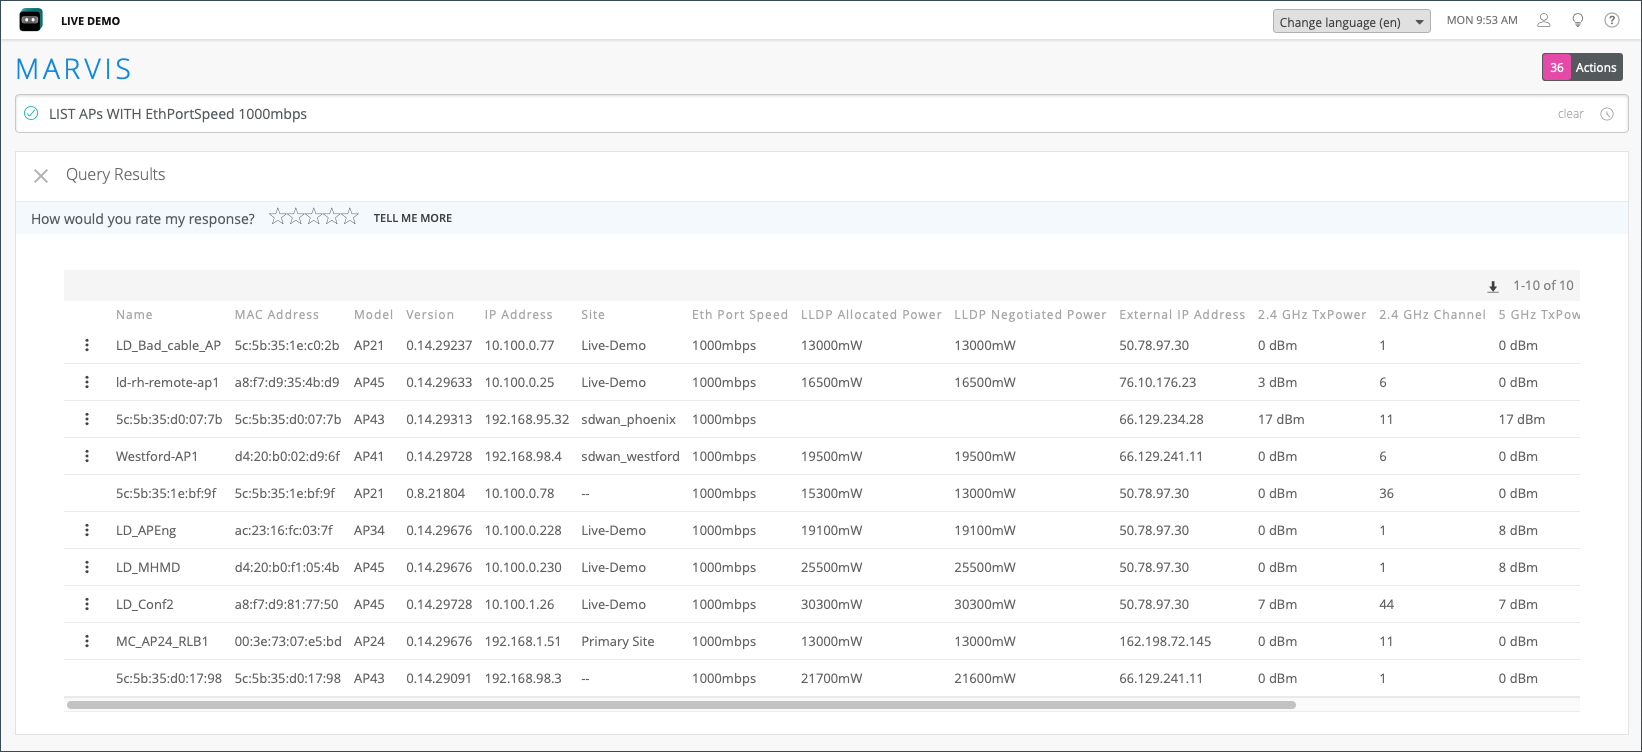
有关有用查询的更多信息,请参阅 使用 Marvis 查询语言进行故障排除。