收集有关 MPLS 会话的统计信息
配置 MPLS 以收集统计信息
您可以通过配置语句配置 statistics MPLS,以便它定期收集有关所有 MPLS 会话(包括中转会话)的流量统计信息。如果要使用 MPLS 管理信息库 (MIB) 的 SNMP 轮询来收集 MPLS 流量统计信息,则必须配置该 statistics 语句。
要启用或禁用 MPLS 统计信息收集,请包含以下 statistics 语句:
statistics {
    auto-bandwidth (MPLS Statistics);
    file filename <files number> <size size> <world-readable | no-world-readable>;
    interval seconds;
    no-transit-statistics;
    transit-statistics-polling;
}
您可以在以下层次结构级别配置这些语句:
[edit protocols mpls][edit logical-systems logical-system-name protocols mpls]
默认间隔为 300 秒。
如果配置该 file 选项,统计信息将放在一个文件中,每个 LSP 一个条目。在指定的时间间隔内,此文件中记录以下信息:
每个 LSP 传输的数据包数、字节数、每秒数据包数和每秒字节数。 Junos OS 11.1R2、11.2R2 和 11.4 版支持在 Junos Trio 芯片组上显示点对多点 LSP 的子 LSP 的数据包和字节统计信息的功能奇偶校验。
通过给定 LSP 传输的带宽百分比与为该 LSP 配置的带宽百分比的关系。如果未为 LSP 配置带宽,则在百分比列中记录 0%。
在每份定期报告的末尾,摘要显示当前时间、会话总数、读取的会话数、忽略的会话数和读取错误(如果有)。忽略的会话通常是未处于启动状态的会话或具有保留(0 到 15)传入标签的会话(通常是 LSP 的出口点)。读取错误的原因与发生错误的 LSP 的条目显示在同一行上。收集统计数据是一个不可靠的过程;偶尔的读取错误可能会影响其准确性。示例输出如下:
lsp6                    0 pkt              0 Byte      0 pps        0 Bps    0
lsp5                    0 pkt              0 Byte      0 pps        0 Bps    0
lsp6.1              34845 pkt        2926980 Byte   1049 pps    88179 Bps  132
lsp5.1                  0 pkt              0 Byte      0 pps        0 Bps    0
lsp4                    0 pkt              0 Byte      0 pps        0 Bps    0
Dec  7 17:28:38 Total 6 sessions: 5 success, 0 fail, 1 ignored
针对 UHP LSP 的按需丢包和延迟测量概述
本主题介绍测量 MPLS 网络中点对点终极跳跃弹出 (UHP) 标签交换路径 (LSP) 的数据包丢失、延迟和吞吐量的方法,以便监控网络性能。
测量丢包和延迟的重要性
IPTV、移动视频等带宽消耗型应用的兴起,加上每比特成本最小化、每比特价值最大化的压力,迫使运营商将其传输网络从基于电路的技术过渡到基于数据包的技术。MPLS 是一种广泛成功的面向连接的数据包传输技术,非常适合基于数据包的传输网络。
随着数据网络上新应用程序的出现,服务提供商准确预测新应用程序推出的影响变得越来越重要。了解网络中的网络性能并对其进行建模对于部署新世界的应用程序以确保成功实施尤为重要。在分组网络中,数据包丢失和延迟是衡量性能的两个最基本的指标。在端到端测量方面,它们的作用更为重要。
属于大多数端到端用户应用程序的流量要么是损失敏感型(文件传输),要么是延迟敏感型(语音或视频应用程序),要么是两者兼而有之(交互式计算应用程序)。服务提供商的服务级别协议 (SLA) 取决于测量和监控这些网络性能指标的能力,因为 SLA 直接或间接取决于服务提供商网络中客户流量体验的丢失和延迟。
为了确保符合 SLA,服务提供商需要工具来测量和监控数据包丢失、单向延迟和双向延迟的性能指标,以及延迟变化和通道吞吐量等相关指标。这种测量功能使服务提供商能够更好地了解其网络的性能特征,从而促进规划、故障排除和网络性能评估。
定义数据包丢失、延迟和吞吐量
在分组网络中,数据包丢失和延迟是衡量性能的两个最基本的指标。
Loss—数据包丢失是指一个或多个传输的数据包无法到达目的地。数据包丢失是指网络为管理拥塞而丢弃的数据包。
数据应用程序对数据包丢失非常宽容,因为它们通常对时间不敏感,并且可以重新传输丢弃的数据包。但是,在视频会议环境和纯音频通信(如 VoIP)中,数据包丢失会产生抖动。
Delay—数据包延迟(也称为延迟)是数据包从一个指定点到达另一个指定点所需的时间,具体取决于传输介质(如铜线、光纤或无线电波)的速度,以及沿途设备(如路由器和调制解调器)的传输延迟。
低延迟表示较高的网络效率。
Throughput—数据包延迟测量操作开始和完成之间的时间量,而吞吐量是在给定时间内发生的此类操作的总数。
丢包和延迟测量机制
数据包延迟和丢失是衡量网络性能的两个基本指标。Junos OS 提供了一种按需机制,用于测量关联的双向 MPLS 终极跳跃弹出 (UHP) 标签交换路径 (LSP) 上的数据包丢失和延迟。
按需延迟和丢包测量机制使用以下 CLI 命令启动:
monitor mpls loss rsvp—对关联的双向 UHP LSP 执行按需损耗测量。monitor mpls delay rsvp— 对关联的双向 UHP LSP 执行按需延迟测量。monitor mpls loss-delay rsvp—对相关的双向 UHP LSP 执行按需组合损耗和延迟测量。
要启动延迟和丢包测量机制,需要输入所需的测量参数,例如测量类型和 LSP 名称。接收参数后,将显示性能监控数据的摘要,并终止机制。
数据包丢失和延迟指标
以下性能指标是使用按需丢包和延迟机制测量的:
丢失测量(数据包和八位字节)
吞吐量测量(数据包和八位字节)
双向通道延迟
往返延迟
数据包间延迟变化 (IPDV)
该 monitor mpls loss rsvp 命令执行丢失和吞吐量测量,该 monitor mpls delay rsvp 命令执行双向通道延迟、往返延迟和 IPDV 测量。该 monitor mpls loss-delay rsvp 命令执行丢失和延迟组合测量,并同时测量上述所有性能指标。
丢包和延迟测量概念
以下概念有助于更好地了解数据包丢失和延迟的功能:
Querier— 查询器是入口提供商边缘 (PE) 路由器,它发起查询消息以进行丢失或延迟测量。
Responder— 响应方是出口 PE 路由器,它接收并响应来自查询器的查询消息。
Associated bidirectional LSP—关联的双向 LSP 由两个单向 LSP 组成,这两个 LSP 通过两个 LSP 端点上的配置捆绑在一起(或相互关联)。
按需损耗和延迟测量只能在关联的双向 UHP LSP 上进行。
Generic associated channel (G-Ach)—通过 MPLS G-ACH 进行按需丢失和延迟测量的性能监控消息。这种类型的通道仅支持带内响应,不支持带外或无响应模式。
Measurement point (MP)—MP 是描述测量条件的位置。
传输端数据包丢失的 MP 位于交换结构和传输接口之间。计数器值在排队等待传输之前会标记在硬件的损耗测量消息中。
接收端数据包丢失的 MP 位于接收接口和交换结构之间。MP 分布在接收端。此外,当传输接口是聚合接口时,MP 也会被分配。
Query rate—查询速率是发送用于丢失和延迟测量的两个查询之间的间隔。
由于丢失和延迟测量消息源自路由引擎,因此多个通道的高查询速率会给路由引擎带来沉重的负担。支持的最小查询间隔为 1 秒。
对于 32 位计数器,查询速率应较高,因为当数据流量速率非常高时,计数器可能会快速换行。当在损失测量中涉及的所有四个测量点位置使用 64 位计数器时,查询速率可能很低。Junos OS 仅支持 64 位计数器。
Traffic class—默认情况下,整个通道支持损耗测量。Junos OS 还支持流量类范围的数据包丢失测量,其中必须创建计数器来维护每个流量类的数据流量统计信息。
默认情况下,不会创建每个流量类计数器。要配置流量类范围的丢失度量,请在层次结构级别包含
traffic-class-statistics语句[edit protocols mpls statistics]。配置 后
traffic-class-statistics,流经 G-Ach 的控制数据包不计入传输和接收计数器。注:启用和禁用流量类统计信息会导致重置 LSP 的所有计数器(聚合计数器和每个类计数器)。
Loss measurement mode—Junos OS 支持按需损耗测量的直接模式,不支持推断模式。
直接丢失测量要求在关联的双向 LSP 的两个单向 LSP 的入口和出口处维护数据流量统计信息。当 MX 系列路由器仅使用 MPC 和 MIC 时,默认情况下会在所有类型的 LSP 入口和 UHP LSP 出口处创建用于维护数据流量统计信息的计数器。
但是,由于以下原因,损耗测量的直接模式并不完全准确:
硬件的并行转发特性。
网络中存在等价多路径 (ECMP),例如聚合以太网接口,这可能导致数据包相对于丢失测量消息重新排序。
不通过 G-ACH 流动的控制数据包不会在 LSP 入口处计数,而是在 LSP 出口处计数。
在 MPLS 网络中实施 Diffserv 时,相对于丢失测量消息的数据流量重新排序,并且丢失测量范围是完整通道,而不是流量类范围。
要克服此限制,请在实现 Diffserv 时执行流量类范围的丢失测量。
注:当与 LSP 关联的入口或出口接口发生变化时,直接模式损耗测量容易受到中断的影响。
Loss measurement synchronization—RFC 6374 第 2.9.8 节中指定的同步条件在绝对意义上不成立。但是,由于损耗测量计数器是在硬件中标记的,因此由于不满足同步条件而引入的错误相对较小。这些误差需要量化。
当 LSP 的发送或接收接口是聚合接口时,与接口为非聚合接口时相比,会引入更多的错误。在任何情况下,损耗测量计数器都印在硬件中,并且需要量化误差。
Delay measurement accuracy— 当传输和接收接口驻留在不同的数据包转发引擎上时,必须在这些数据包转发引擎上同步时钟以进行双向延迟测量。此条件适用于实现按需延迟测量功能的平台。
当存在聚合接口或 ECMP 时,仅测量其中一个潜在路径的延迟。
当使用组合损耗和延迟消息进行延迟计算时,与在某些情况下使用延迟测量消息时相比,延迟的精度较低,例如当发送或接收接口是聚合接口时。
延迟测量始终基于每个流量类执行,测量的准确性需要在测试后量化。
Timestamp format—Junos OS 仅支持 IEEE 1588 精确时间协议 (PTP) [IEEE1588] 格式来记录延迟测量消息。不支持网络时间格式 (NTP)。
Operations, administration, and maintenance (OAM)— 要指示 MPLS LSP 的所有 OAM 消息都通过 MPLS G-Ach 传输,并允许 MPLS 性能监控消息通过 MPLS G-Ach 传输,必须在层次结构级别包含
[edit protocols mpls label-switched-path lsp-name]该oam mpls-tp-mode语句。
丢包和延迟测量功能
图 1 说明了用于双向测量数据包丢失和延迟的基本方法。路由器 A 和路由器 B 这两个路由器之间存在双向通道。时间参考点(T1、T2、T3 和 T4)与在路由器 A 上进行的测量操作相关联。该操作包括路由器 A 向路由器 B 发送查询消息,路由器 B 发回响应。每个参考点指示通过通道传输或接收查询或响应消息的时间点。
在 中 图 1,路由器 A 可以通过向路由器 B 发送丢失测量查询消息来安排在通道上正向和反向测量数据包。每个正向和反向消息都包含在时间 T1 之前通过通道传输到路由器 B (A_TxP) 的数据包计数。
当消息到达路由器 B 时,将向消息附加两个值,并将消息反射回路由器 A。这两个值是在时间 T2 之前通过通道从路由器 A (B_RxP) 接收的数据包计数,以及在时间 T3 之前通过通道传输到路由器 A (B_TxP) 的数据包计数。
当响应到达路由器 A 时,消息将附加第四个值 – 在时间 T4 之前通过路由器 B (A_RxP) 通道接收的数据包计数。
这四个计数器值((A_TxP)、(B_RxP)、(B_TxP) 和 (A_RxP) 使路由器 A 能够计算所需的丢失统计信息。由于路由器 A 的传输计数和路由器 B 的接收计数(反之亦然)在第一条消息发出时可能不会同步,并且为了限制计数器包装的影响,因此损失以消息之间的增量形式计算。
路由器 A 计算消息 LM[n-1] 和 LM[n] 标记的测量间隔内的传输损耗 (A_TxLoss[n-1,n]) 和接收损耗 (A_RxLoss[n-1,n]),计算如下:
A_TxLoss[n-1,n] = (A_TxP[n] - A_TxP[n-1]) - (B_RxP[n] - B_RxP[n-1])
A_RxLoss[n-1,n] = (B_TxP[n] - B_TxP[n-1]) - (A_RxP[n] - A_RxP[n-1])
算术是计数器大小的模数。
为了在路由器 A 上测量通道到路由器 B 的延迟,从路由器 A 向路由器 B 发送延迟测量查询消息,其中包含记录传输时刻的时间戳。在 中 图 1,时间戳记录在 T1 中。
当消息到达路由器 B 时,将添加一个时间戳,记录接收消息的时刻 (T2)。消息现在可以从路由器 B 反射到路由器 A,路由器 B 添加其传输时间戳 (T3),路由器 A 添加其接收时间戳 (T4)。
这四个时间戳(T1、T2、T3 和 T4)使路由器 A 能够计算每个方向的单向延迟以及通道的双向延迟。单向延迟计算要求同步路由器 A 和 B 的时钟。
此时,路由器 A 可以计算与通道关联的双向通道延迟和往返延迟,如下所示:
双向通道延迟 = (T4 - T1) - (T3 - T2)
往返延迟 = T4 - T1
丢包和延迟功能
Supported Features of Packet Loss and Delay
Junos OS 通过按需丢失和延迟测量支持以下功能:
仅针对关联的双向 MPLS 点对点 UHP LSP 进行性能监控
损耗测量
吞吐量测量
双向延迟测量(通道延迟和往返延迟)
数据包间延迟变化 (IPDV)
直接模式损耗测量
聚合以太网和聚合 SONET 接口
多机箱支持
兼容 64 位
Unsupported Features of Packet Loss and Delay
Junos OS 不支持以下按需丢失和延迟测量功能:
伪线的损耗和延迟测量(RFC 6374 第 2.9.1 节)
单向测量(RFC 6374 第 2.6 节)
二元测量(RFC 6374 第 2.7 节)
环回模式下的损耗和延迟测量(RFC 6374 第 2.8 节)
从 LSP 端点到中间节点的丢失和延迟测量(RFC 6374 的 2.9.5 节)
外部后处理(RFC 6374 的 2.9.7 节)
推断模式损耗测量(RFC 6374 第 2.9.8 节)
主动模式
逻辑系统
SNMP
示例:配置按需丢失和延迟测量
此示例说明如何为 MPLS 网络中的点对点终极跳跃弹出 (UHP) 标签交换路径 (LSP) 启用按需丢失和延迟测量,以监控网络性能。
要求
此示例使用以下硬件和软件组件:
-
两个仅包含 MPC/MIC 的 MX 系列 5G 通用路由平台
-
在所有路由器上运行的 Junos OS 14.2 或更高版本
准备工作:
-
配置设备接口。
-
配置设备的自治系统编号和路由器 ID。
-
配置以下协议:
-
RSVP
-
MPLS
-
OSPF
-
概述
从 Junos OS 14.2 版开始,引入了一种按需工具,用于监控和测量相关双向 MPLS 终极跳跃弹出 (UHP) 点对点标签交换路径 (LSP) 的数据包丢失和/或数据包延迟。可以使用以下 CLI 命令启用该工具 – monitor mpls loss rsvp、 monitor mpls delay rsvp和 monitor mpls loss-delay rsvp。
这些命令按需提供直接模式数据包丢失、双向数据包延迟和相关指标(如数据包间延迟变化和通道吞吐量测量)的性能指标摘要。
此功能提供对网络性能的实时可见性,从而有助于网络性能规划、故障排除和评估。
配置
CLI 快速配置
要快速配置此示例,请复制以下命令,将其粘贴到文本文件中,删除所有换行符,更改详细信息,以便与网络配置匹配,将命令复制并粘贴到 [edit] 层级的 CLI 中,然后从配置模式进入 commit 。
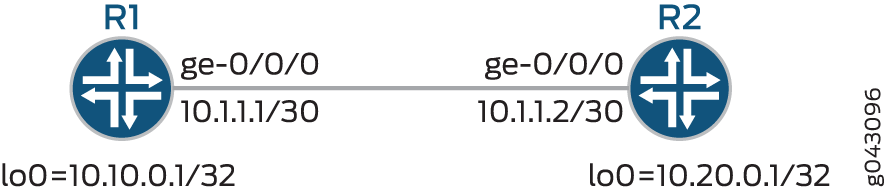
R1
set chassis fpc 0 pic 3 tunnel-services bandwidth 1g
set chassis network-services enhanced-ip
set interfaces ge-0/0/0 unit 0 family inet address 10.1.1.1/30
set interfaces ge-0/0/0 unit 0 family mpls
set interfaces lo0 unit 0 family inet address 10.10.0.1/32
set interfaces lo0 unit 0 family mpls
set routing-options router-id 10.10.0.1
set protocols rsvp interface ge-0/0/0.0
set protocols rsvp interface lo0.0
set protocols rsvp interface fxp0.0 disable
set protocols mpls statistics traffic-class-statistics
set protocols mpls label-switched-path R1-R2 to 10.20.0.1
set protocols mpls label-switched-path R1-R2 oam mpls-tp-mode
set protocols mpls label-switched-path R1-R2 ultimate-hop-popping
set protocols mpls label-switched-path R1-R2 associate-lsp R2-R1
set protocols mpls interface ge-0/0/0.0
set protocols mpls interface lo0.0
set protocols mpls interface fxp0.0 disable
set protocols ospf traffic-engineering
set protocols ospf area 0.0.0.0 interface ge-0/0/0.0
set protocols ospf area 0.0.0.0 interface lo0.0
set protocols ospf area 0.0.0.0 interface fxp0.0 disable
R2
set chassis fpc 0 pic 3 tunnel-services bandwidth 1g
set chassis network-services enhanced-ip
set interfaces ge-0/0/0 unit 0 family inet address 10.1.1.2/30
set interfaces ge-0/0/0 unit 0 family mpls
set interfaces lo0 unit 0 family inet address 10.20.0.1/32
set interfaces lo0 unit 0 family mpls
set routing-options router-id 10.20.0.1
set protocols rsvp interface ge-0/0/0.0
set protocols rsvp interface lo0.0
set protocols rsvp interface fxp0.0 disable
set protocols mpls statistics traffic-class-statistics
set protocols mpls label-switched-path R2-R1 to 10.10.0.1
set protocols mpls label-switched-path R2-R1 oam mpls-tp-mode
set protocols mpls label-switched-path R2-R1 ultimate-hop-popping
set protocols mpls label-switched-path R2-R1 associate-lsp R1-R2
set protocols mpls interface ge-0/0/0.0
set protocols mpls interface lo0.0
set protocols mpls interface fxp0.0 disable
set protocols ospf traffic-engineering
set protocols ospf area 0.0.0.0 interface ge-0/0/0.0
set protocols ospf area 0.0.0.0 interface lo0.0
set protocols ospf area 0.0.0.0.interface fxp0.0 disable
程序
分步过程
以下示例要求您在配置层次结构中导航各个级别。有关导航 CLI 的信息,请参阅 CLI 用户指南中的在配置模式下使用 CLI 编辑器。
要配置路由器 R1:
-
为机箱启用隧道服务和增强型 IP 网络服务配置。
[edit chassis]
user@R1# set fpc 0 pic 3 tunnel-services bandwidth 1g
user@R1# set network-services enhanced-ip
-
配置路由器 R1 的接口。
[edit interfaces]
user@R1# set ge-0/0/0 unit 0 family inet address 10.1.1.1/30
user@R1# set ge-0/0/0 unit 0 family mpls
user@R1# set lo0 unit 0 family inet address 10.10.0.1/32
user@R1# set lo0 unit 0 family mpls
-
配置路由器 R1 的路由器 ID。
[edit routing-options]
user@R1# set router-id 10.10.0.1
-
在路由器 R1 的所有接口上启用 RSVP,管理接口除外。
[edit protocols]
user@R1# set rsvp interface ge-0/0/0.0
user@R1# set rsvp interface lo0.0
user@R1# set rsvp interface fxp0.0 disable
-
在路由器 R1 的所有接口上启用 MPLS,管理接口除外。
[edit protocols]
user@R1# set mpls interface ge-0/0/0.0
user@R1# set mpls interface lo0.0
user@R1# set mpls interface fxp0.0 disable
-
配置到路由器 R2 的关联双向 LSP。
[edit protocols]
user@R1# set mpls label-switched-path R1-R2 to 10.20.0.1
user@R1# set mpls label-switched-path R1-R2 oam mpls-tp-mode
user@R1# set mpls label-switched-path R1-R2 ultimate-hop-popping
user@R1# set mpls label-switched-path R1-R2 associate-lsp R2-R1
-
创建流量类以维护每个流量类的数据流量统计信息。
这样可以启用流量类范围的丢失测量。
[edit protocols]
user@R1# set mpls statistics traffic-class-statistics
-
使用流量工程功能配置 OSPF,并在路由器 R1 的所有接口(管理接口除外)上启用 OSPF。
[edit protocols]
user@R1# set ospf traffic-engineering
user@R1# set ospf area 0.0.0.0 interface ge-0/0/0.0
user@R1# set ospf area 0.0.0.0 interface lo0.0
user@R1# set ospf interface fxp0.0 disable
结果
在配置模式下,输入 show chassis 、show interfaces、show routing-options 和 show protocols 命令,以确认您的配置。如果输出未显示预期的配置,请重复此示例中的说明,以便进行更正。
user@R1# show chassis
fpc 0 {
    pic 3 {
        tunnel-services {
            bandwidth 1g;
        }
    }
}
network-services enhanced-ip;
user@R1# show interfaces
ge-0/0/0 {
    unit 0 {
        family inet {
            address 1o.1.1.1/30;
        }
        family mpls;
    }
}
lo0 {
    unit 0 {
        family inet {
            address 10.10.0.1/32;
        }
        family mpls;
    }
}
user@R1# show routing-options
router-id 10.10.0.1;
user@R1# show protocols
rsvp {
    interface ge-0/0/0.0;
    interface lo0.0;
    interface fxp0.0 {
        disable;
    }
}
mpls {
    statistics {
        traffic-class-statistics;
    }
    label-switched-path R1-R2 {
        to 10.20.0.1;
        oam mpls-tp-mode;
        ultimate-hop-popping;
        associate-lsp R2-R1;
    }
    interface ge-0/0/0.0;
    interface lo0.0;
    interface fxp0.0 {
        disable;
    }
}
ospf {
    traffic-engineering;
    area 0.0.0.0 {
        interface ge-0/0/0.0;
        interface lo0.0;
        interface fxp0.0 {
            disable;
        }
    }
}
验证
确认配置工作正常。
验证 LSP 状态
目的
验证路由器 R1 和 R2 之间的关联双向 LSP 是否已启动。
操作
在操作模式下,运行 show mpls lsp 命令。
user@R1> show mpls lsp
Ingress LSP: 1 sessions
To              From            State Rt P     ActivePath       LSPname
10.20.0.1        10.10.0.1        Up     0 *                      R1-R2 Assoc-Bidir
Total 1 displayed, Up 1, Down 0

Egress LSP: 1 sessions
To              From            State   Rt Style Labelin Labelout LSPname
10.10.0.1        10.20.0.1        Up       0  1 FF  299776        - R2-R1 Assoc-Bidir
Total 1 displayed, Up 1, Down 0

Transit LSP: 0 sessions
Total 0 displayed, Up 0, Down 0
意义
关联的双向 LSP R1-R2 已启动并处于活动状态。
验证丢包率测量
目的
验证按需损失测量结果。
操作
在操作模式下,运行 monitor mpls loss rsvp R1-R2 count 2 detail 命令。
user@R1> monitor mpls loss rsvp R1-R2 count 2 detail
(0)
Response code                            : Success
Origin timestamp                         : 1404129082 secs, 905571890 nsecs
Forward transmit count                   : 83040
Forward receive count                    : 83040
Reverse transmit count                   : 83100
Reverse receive count                    : 83100
(1)
Response code                            : Success
Origin timestamp                         : 1404129083 secs, 905048410 nsecs
Forward transmit count                   : 83841
Forward receive count                    : 83841
Reverse transmit count                   : 83904
Reverse receive count                    : 83904
Current forward transmit count           : 801
Current forward receive count            : 801
Current forward loss                     : 0 packets
Current forward loss ratio               : 0.000000
Current forward throughput               : 0.801 kpps
Current reverse transmit count           : 804
Current reverse receive count            : 804
Current reverse loss                     : 0 packets
Current reverse loss ratio               : 0.000000
Current reverse throughput               : 0.804 kpps
(2)
Response code                            : Success
Origin timestamp                         : 1404129084 secs, 904828715 nsecs
Forward transmit count                   : 84423
Forward receive count                    : 84423
Reverse transmit count                   : 84487
Reverse receive count                    : 84487
Current forward transmit count           : 582
Current forward receive count            : 582
Current forward loss                     : 0 packets
Current forward loss ratio               : 0.000000
Current forward throughput               : 0.582 kpps
Current reverse transmit count           : 583
Current reverse receive count            : 583
Current reverse loss                     : 0 packets
Current reverse loss ratio               : 0.000000
Current reverse throughput               : 0.583 kpps

Cumulative forward transmit count        : 1383
Cumulative forward loss                  : 0 packets
Average forward loss ratio               : 0.000000
Average forward throughput               : 0.692 kpps
Cumulative reverse transmit count        : 1387
Cumulative reverse loss                  : 0 packets
Average reverse loss ratio               : 0.000000
Average reverse throughput               : 0.694 kpps

LM queries sent                          : 3
LM responses received                    : 3
LM queries timedout                      : 0
LM responses dropped due to errors       : 0
意义
将显示两个计数的丢包测量值。
验证数据包延迟测量
目的
验证按需延迟测量结果。
操作
在操作模式下,运行 monitor mpls delay rsvp R1-R2 count 2 detail 命令。
user@R1> monitor mpls delay rsvp R1-R2 count 2 detail
(1)
Response code                            : Success
Querier transmit timestamp               : 1404129122 secs, 479955401 nsecs
Responder receive timestamp              : 1404129122 secs, 468519022 nsecs
Responder transmit timestamp             : 1404129122 secs, 470255123 nsecs
Querier receive timestamp                : 1404129122 secs, 481736403 nsecs
Current two-way channel delay            : 44 usecs
Current round-trip-time                  : 1781 usecs
(2)
Response code                            : Success
Querier transmit timestamp               : 1404129123 secs, 480926210 nsecs
Responder receive timestamp              : 1404129123 secs, 469488696 nsecs
Responder transmit timestamp             : 1404129123 secs, 471130706 nsecs
Querier receive timestamp                : 1404129123 secs, 482613911 nsecs
Current two-way channel delay            : 45 usecs
Current round-trip-time                  : 1687 usecs

Best two-way channel delay               : 44 usecs
Worst two-way channel delay              : 45 usecs
Average two-way channel delay            : 45 usecs
Best round-trip-time                     : 1687 usecs
Worst round-trip-time                    : 1781 usecs
Average round-trip-time                  : 1734 usecs
Average forward delay variation          : 1 usecs
Average reverse delay variation          : 1 usecs

DM queries sent                          : 2
DM responses received                    : 2
DM queries timedout                      : 0
DM responses dropped due to errors       : 0
意义
将显示两个计数的数据包延迟测量值。
验证丢包延迟测量
目的
验证按需丢失和延迟测量结果。
操作
在操作模式下,运行 monitor mpls loss-delay rsvp R1-R2 count 2 detail 命令。
user@R1> monitor mpls loss-delay rsvp R1-R2 count 2 detail
(0)
Response code                            : Success
Forward transmit count                   : 142049
Forward receive count                    : 142049
Reverse transmit count                   : 142167
Reverse receive count                    : 142167
Querier transmit timestamp               : 1404129161 secs, 554422723 nsecs
Responder receive timestamp              : 1404129161 secs, 542877570 nsecs
Responder transmit timestamp             : 1404129161 secs, 546004545 nsecs
Querier receive timestamp                : 1404129161 secs, 557599327 nsecs
(1)
Response code                            : Success
Forward transmit count                   : 143049
Forward receive count                    : 143049
Reverse transmit count                   : 143168
Reverse receive count                    : 143168
Current forward transmit count           : 1000
Current forward receive count            : 1000
Current forward loss                     : 0 packets
Current forward loss ratio               : 0.000000
Current forward throughput               : 1.000 kpps
Current reverse transmit count           : 1001
Current reverse receive count            : 1001
Current reverse loss                     : 0 packets
Current reverse loss ratio               : 0.000000
Current reverse throughput               : 1.001 kpps
Querier transmit timestamp               : 1404129162 secs, 554465742 nsecs
Responder receive timestamp              : 1404129162 secs, 542919166 nsecs
Responder transmit timestamp             : 1404129162 secs, 545812736 nsecs
Querier receive timestamp                : 1404129162 secs, 557409175 nsecs
Current two-way channel delay            : 49 usecs
Current round-trip-time                  : 2943 usecs
(2)
Response code                            : Success
Forward transmit count                   : 143677
Forward receive count                    : 143677
Reverse transmit count                   : 143799
Reverse receive count                    : 143799
Current forward transmit count           : 628
Current forward receive count            : 628
Current forward loss                     : 0 packets
Current forward loss ratio               : 0.000000
Current forward throughput               : 0.627 kpps
Current reverse transmit count           : 631
Current reverse receive count            : 631
Current reverse loss                     : 0 packets
Current reverse loss ratio               : 0.000000
Current reverse throughput               : 0.630 kpps
Querier transmit timestamp               : 1404129163 secs, 556698575 nsecs
Responder receive timestamp              : 1404129163 secs, 545150128 nsecs
Responder transmit timestamp             : 1404129163 secs, 546918408 nsecs
Querier receive timestamp                : 1404129163 secs, 558515047 nsecs
Current two-way channel delay            : 48 usecs
Current round-trip-time                  : 1816 usecs

Cumulative forward transmit count        : 1628
Cumulative forward loss                  : 0 packets
Average forward loss ratio               : 0.000000
Average forward throughput               : 0.813 kpps
Cumulative reverse transmit count        : 1632
Cumulative reverse loss                  : 0 packets
Average reverse loss ratio               : 0.000000
Average reverse throughput               : 0.815 kpps

Best two-way channel delay               : 48 usecs
Worst two-way channel delay              : 49 usecs
Average two-way channel delay            : 49 usecs
Best round-trip-time                     : 1816 usecs
Worst round-trip-time                    : 3176 usecs
Average round-trip-time                  : 2645 usecs
Average forward delay variation          : 1 usecs
Average reverse delay variation          : 0 usecs

LDM queries sent                         : 3
LDM responses received                   : 3
LDM queries timedout                     : 0
LDM responses dropped due to errors      : 0
意义
显示两个计数的丢包和延迟测量值。
示例:为双向 MPLS LSP 配置主动丢失和延迟测量
此示例说明如何为 MPLS 网络中的点对点终极跳跃弹出标签交换路径 (LSP) 配置主动丢失和延迟测量,以监控网络性能。
要求
此示例使用以下硬件和软件组件:
-
两个仅包含 MPC/MIC 的 MX 系列 5G 通用路由平台
-
在所有路由器上运行的 Junos OS 15.1 或更高版本
准备工作:
-
配置设备接口。
-
配置设备的自治系统编号和路由器 ID。
-
配置以下协议:
-
MPLS
-
OSPF
-
RSVP
-
概述
从 Junos OS 15.1 版开始,引入了一种主动工具,用于监控和测量数据包丢失和/或测量相关的双向 MPLS 终极跳跃点对点标签交换路径 (LSP)。
此功能提供以下性能指标:
-
数据包间延迟变化 (IPDV)
-
损耗测量
-
往返延迟 (RTT)
-
吞吐量测量
-
双向通道延迟
此功能提供对网络性能的实时可见性,从而有助于网络性能规划、故障排除和评估。
配置
CLI 快速配置
要快速配置此示例,请复制以下命令,将其粘贴到文本文件中,删除所有换行符,更改详细信息,以便与网络配置匹配,将命令复制并粘贴到 [edit] 层级的 CLI 中,然后从配置模式进入 commit 。
R1
set chassis network-services enhanced-ip
set interfaces ge-0/0/0 unit 0 family inet address 10.1.1.1/30
set interfaces ge-0/0/0 unit 0 family mpls
set interfaces lo0 unit 0 family inet address 10.10.0.1/32
set interfaces lo0 unit 0 family mpls
set protocols mpls interface ge-0/0/0.0
set protocols mpls interface lo0.0
set protocols mpls interface fxp0.0 disable
set protocols mpls label-switched-path R1-R2 associate-lsp R2-R1
set protocols mpls label-switched-path R1-R2 install 10.20.0.0/24 active
set protocols mpls label-switched-path R1-R2 oam mpls-tp-mode
set protocols mpls label-switched-path R1-R2 oam performance-monitoring querier delay traffic-class tc-0 query-interval 1000
set protocols mpls label-switched-path R1-R2 oam performance-monitoring querier loss traffic-class none query-interval 1000
set protocols mpls label-switched-path R1-R2 oam performance-monitoring querier loss-delay traffic-class tc-0 query-interval 1000
set protocols mpls label-switched-path R1-R2 oam performance-monitoring responder delay min-query-interval 1000
set protocols mpls label-switched-path R1-R2 oam performance-monitoring responder loss min-query-interval 1000
set protocols mpls label-switched-path R1-R2 to 10.20.0.1
set protocols mpls label-switched-path R1-R2 ultimate-hop-popping
set protocols mpls statistics traffic-class-statistics
set protocols ospf area 0.0.0.0 interface ge-0/0/0.0
set protocols ospf area 0.0.0.0 interface lo0.0
set protocols ospf area 0.0.0.0 interface fxp0.0 disable
set protocols ospf traffic-engineering
set protocols rsvp interface ge-0/0/0.0
set protocols rsvp interface lo0.0
set protocols rsvp interface fxp0.0 disable
set routing-options router-id 10.10.0.1
R2
set chassis network-services enhanced-ip
set interfaces ge-0/0/0 unit 0 family inet address 10.1.1.2/30
set interfaces ge-0/0/0 unit 0 family mpls
set interfaces lo0 unit 0 family inet address 10.20.0.1/32
set interfaces lo0 unit 0 family mpls
set protocols mpls interface ge-0/0/0.0
set protocols mpls interface lo0.0
set protocols mpls interface fxp0.0 disable
set protocols mpls label-switched-path R2-R1 associate-lsp R1-R2
set protocols mpls label-switched-path R2-R1 install 10.10.0.0/24 active
set protocols mpls label-switched-path R2-R1 oam mpls-tp-mode
set protocols mpls label-switched-path R2-R1 oam performance-monitoring responder delay min-query-interval 1000
set protocols mpls label-switched-path R2-R1 oam performance-monitoring responder loss min-query-interval 1000
set protocols mpls label-switched-path R2-R1 oam performance-monitoring querier delay traffic-class tc-0 query-interval 1000
set protocols mpls label-switched-path R2-R1 oam performance-monitoring querier loss traffic-class none query-interval 1000
set protocols mpls label-switched-path R2-R1 oam performance-monitoring querier loss-delay traffic-class tc-0 query-interval 1000
set protocols mpls label-switched-path R2-R1 to 10.10.0.1
set protocols mpls label-switched-path R2-R1 ultimate-hop-popping
set protocols mpls statistics traffic-class-statistics
set protocols ospf area 0.0.0.0 interface ge-0/0/0.0
set protocols ospf area 0.0.0.0 interface lo0.0
set protocols ospf area 0.0.0.0 interface fxp0.0 disable
set protocols ospf traffic-engineering
set protocols rsvp interface ge-0/0/0.0
set protocols rsvp interface lo0.0
set protocols rsvp interface fxp0.0 disable
set routing-options router-id 10.20.0.1
程序
分步过程
以下示例要求您在配置层次结构中导航各个级别。有关导航 CLI 的信息,请参阅 CLI 用户指南中的在配置模式下使用 CLI 编辑器。
要配置路由器 R1:
-
启用增强的 IP 网络服务配置。
[edit chassis]
user@R1# set network-services enhanced-ip
-
配置路由器 R1 的接口。
[edit interfaces]
user@R1# set ge-0/0/0 unit 0 family inet address 10.1.1.1/30
user@R1# set ge-0/0/0 unit 0 family mpls
user@R1# set lo0 unit 0 family inet address 10.10.0.1/32
user@R1# set lo0 unit 0 family mpls
-
配置路由器 R1 的路由器 ID。
[edit routing-options]
user@R1# set router-id 10.10.0.1
-
在路由器 R1 的所有接口上启用 RSVP,管理接口除外。
[edit protocols]
user@R1# set rsvp interface ge-0/0/0.0
user@R1# set rsvp interface lo0.0
user@R1# set rsvp interface fxp0.0 disable
-
在路由器 R1 的所有接口上启用 MPLS,管理接口除外。
[edit protocols]
user@R1# set mpls interface ge-0/0/0.0
user@R1# set mpls interface lo0.0
user@R1# set mpls interface fxp0.0 disable
-
配置到路由器 R2 的关联双向 LSP。
[edit protocols]
user@R1# set mpls label-switched-path R1-R2 to 10.20.0.1
user@R1# set mpls label-switched-path R1-R2 install 10.20.0.0/24 active
user@R1# set mpls label-switched-path R1-R2 oam mpls-tp-mode
user@R1# set mpls label-switched-path R1-R2 ultimate-hop-popping
user@R1# set mpls label-switched-path R1-R2 associate-lsp R2-R1
-
创建流量类以维护每个流量类的数据流量统计信息。
这样可以测量流量类范围的丢失和延迟。
[edit protocols]
user@R1# set mpls statistics traffic-class-statistics
-
在查询端配置性能监控。
[edit protocols]
user@R1# set mpls label-switched-path R1-R2 oam performance-monitoring querier delay traffic-class tc-0 query-interval 1000
user@R1# set mpls label-switched-path R1-R2 oam performance-monitoring querier loss traffic-class none query-interval 1000
user@R1# set mpls label-switched-path R1-R2 oam performance-monitoring querier loss-delay traffic-class tc-0 query-interval 1000
-
在响应方端配置性能监控。
[edit protocols]
user@R1# set mpls label-switched-path R1-R2 oam performance-monitoring responder delay min-query-interval 1000
user@R1# set mpls label-switched-path R1-R2 oam performance-monitoring responder loss min-query-interval 1000
-
使用流量工程功能配置 OSPF,并在路由器 R1 的所有接口(管理接口除外)上启用 OSPF。
[edit protocols]
user@R1# set ospf traffic-engineering
user@R1# set ospf area 0.0.0.0 interface ge-0/0/0.0
user@R1# set ospf area 0.0.0.0 interface lo0.0
user@R1# set ospf interface fxp0.0 disable
结果
在配置模式下,输入 show chassis 、show interfaces、show routing-options 和 show protocols 命令,以确认您的配置。如果输出未显示预期的配置,请重复此示例中的说明,以便进行更正。
user@R1# show chassis
network-services enhanced-ip;
user@R1# show interfaces
ge-0/0/0 {
    unit 0 {
        family inet {
            address 10.1.1.1/30;
        }
        family mpls;
    }
}
lo0 {
    unit 0 {
        family inet {
            address 10.10.0.1/32;
        }
        family mpls;
    }
}
user@R1# show routing-options
router-id 10.10.0.1;
user@R1# show protocols
rsvp {
    interface ge-0/0/0.0;
    interface lo0.0;
    interface fxp0.0 {
        disable;
    }
}
mpls {
    label-switched-path R1-R2 {
        to 10.20.0.1;
        install 10.20.0.0/24  active;
        oam {
            mpls-tp-mode;
            performance-monitoring {
                querier {
                    loss {
                        traffic-class none {
                            query-interval 1000;
                        }
                    }
                    delay {
                        traffic-class tc-0 {
                            query-interval 1000;
                        }
                    }
                    loss-delay {
                        traffic-class none {
                            query-interval 1000;
                        }
                    }
                }
                responder {
                    loss {
                        min-query-interval 1000;
                    }
                    delay {
                        min-query-interval 1000;
                    }
                }
            }
        }
        ultimate-hop-popping;
        associate-lsp R2-R1;
    }
}
ospf {
    traffic-engineering;
    area 0.0.0.0 {
        interface ge-0/0/0.0;
        interface lo0.0;
        interface fxp0.0 {
            disable;
        }
    }
}
验证
验证丢失和延迟测量
目的
验证丢失和延迟测量。
操作
在操作模式下,运行 show performance-monitoring mpls lsp 命令。
user@R1> show performance-monitoring mpls lsp
Session Total: 3 Up: 3 Down: 0
  LSP name:R1-R2, PM State:Up
    Loss measurement Data:
      Duration: 00:04:43
      Traffic-class: None
      Queries sent: 282
      Responses received: 282
      Responses dropped due to errors: 0
      Queries timeout: 0
      Forward loss measurement:
        Average packet loss: 0
        Average packet throughput: 554338
      Reverse loss measurement:
        Average packet loss: 0
        Average packet throughput: 1352077
  LSP name:R1-R2, PM State:Up
    Delay measurement Data:
      Duration: 00:04:43
      Traffic-class: 0
      Queries sent: 282
      Responses received: 282
      Responses dropped due to errors: 0
      Queries timeout: 0
      Best 2-way channel delay: 72 usecs
      Worst 2-way channel delay: 365 usecs
      Best round trip time: 843 usecs
      Worst round trip time: 105523 usecs
      Avg absolute fw delay variation: 1619 usecs
      Avg absolute rv delay variation: 1619 usecs
  LSP name:R1-R2, PM State:Up
    Loss measurement Data:
      Duration: 00:04:43
      Traffic-class: None
      Queries sent: 282
      Responses received: 282
      Responses dropped due to errors: 0
      Queries timeout: 0
      Forward loss measurement:
        Average packet loss: 0
        Average packet throughput: 553927
      Reverse loss measurement:
        Average packet loss: 0
        Average packet throughput: 1351531
    Delay measurement Data:
      Best 2-way channel delay: 76 usecs
      Worst 2-way channel delay: 368 usecs
      Best round trip time: 1082 usecs
      Worst round trip time: 126146 usecs
      Avg absolute fw delay variation: 1618 usecs
      Avg absolute rv delay variation: 1619 usecs
意义
将显示 LSP 的丢包和延迟测量指标。
配置按需丢失和延迟测量
您可以为 MPLS 网络中的点对点终极跳跃弹出 (UHP) 标签交换路径 (LSP) 配置按需丢失和延迟测量,以监控网络性能。、 monitor mpls delay rsvp和 monitor mpls loss-delay rsvp CLI 命令按需monitor mpls loss rsvp提供直接模式数据包丢失、双向数据包延迟和相关指标(如数据包间延迟变化和通道吞吐量测量)的性能指标摘要。
此功能提供对网络性能的实时可见性,从而有助于网络性能规划、故障排除和评估。
准备工作:
配置设备接口。
配置设备路由器 ID。
配置以下协议:
RSVP
OSPF
启用流量工程功能。
MPLS
要配置 PE 设备,请执行以下操作:
配置主动丢失和延迟测量
您可以为 MPLS 网络中的点对点终极跳跃弹出标签交换路径 (LSP) 配置主动丢失和延迟测量,以监控网络性能。show performance-monitoring mpls lsp CLI 命令提供直接模式数据包丢失、双向数据包延迟和相关指标(如数据包间延迟变化和通道吞吐量测量)的性能指标摘要。
此功能提供对网络性能的实时可见性,从而有助于网络性能规划、故障排除和评估。
此功能提供以下性能指标:
数据包间延迟变化 (IPDV)
损耗测量
往返延迟 (RTT)
吞吐量测量
双向通道延迟
准备工作:
配置设备接口。
配置设备的自治系统编号和路由器 ID。
配置以下协议:
MPLS
OSPF
RSVP
要在 PE 设备上配置主动损耗和延迟测量: