示例:MX 系列路由器的采样配置
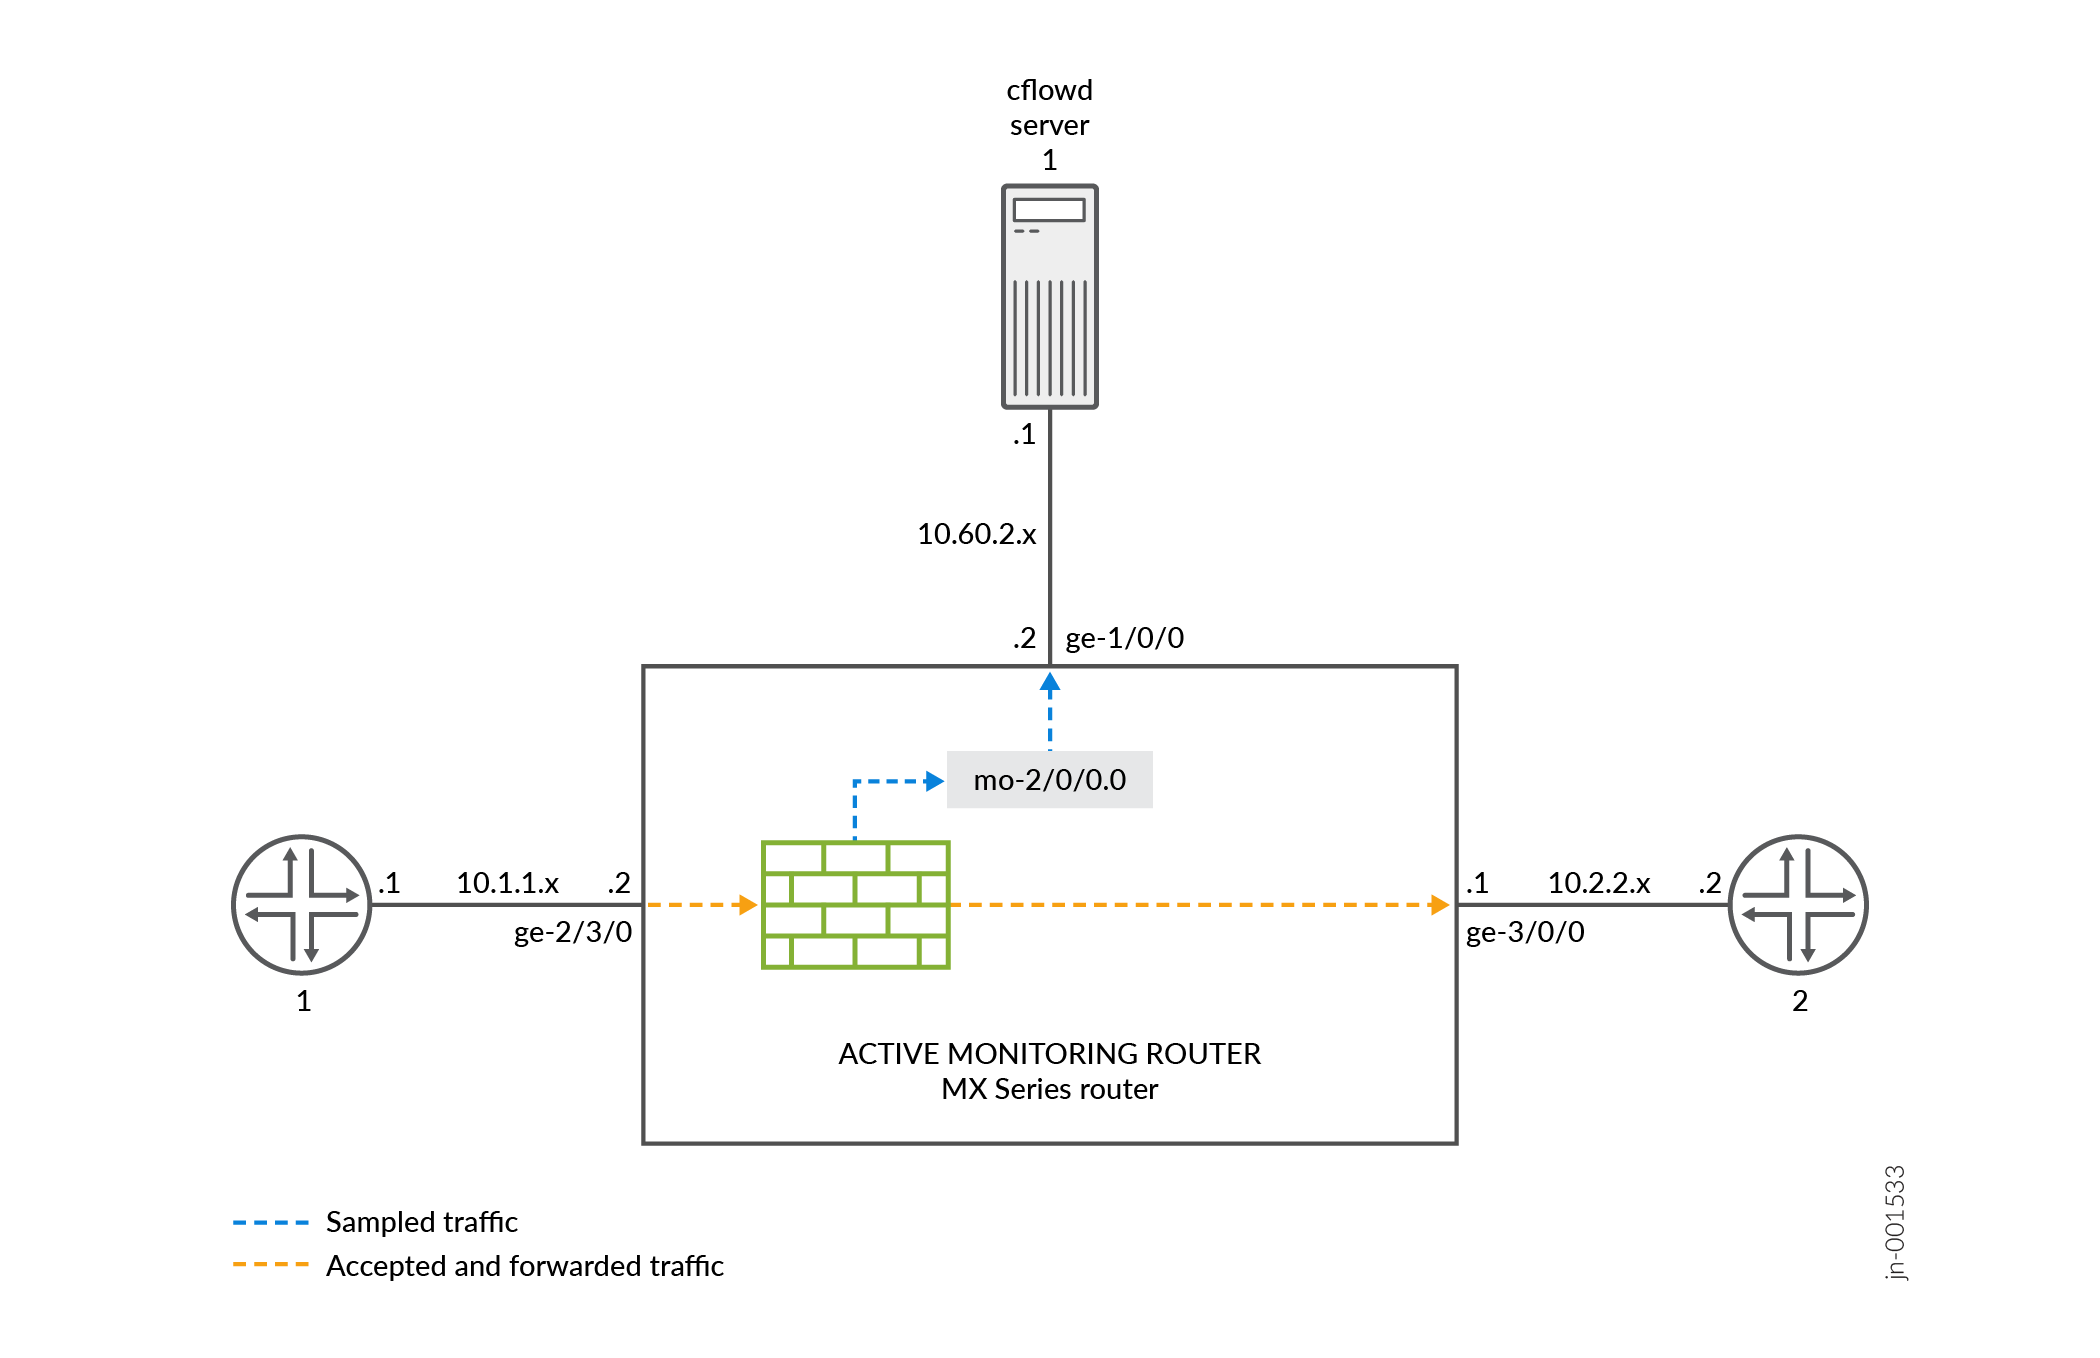
在 图 1 中,来自路由器 1 的流量到达监控路由器的千兆以太网 ge-2/3/0 接口。监控路由器上通向目标路由器 2 的出口接口为 ge-3/0/0。在主动流监控中,输入接口和出口接口都可以是任何接口类型(如千兆以太网)。通向流服务器的导出接口为 ge-1/0/0。
配置防火墙过滤器以采样、计数和接受所有流量。将过滤器应用于输入接口,并配置出口接口(用于流量转发)、自适应服务接口(用于流处理)和导出接口(用于导出流记录)。
在层次结构级别配置[edit forwarding-options]采样。在语句中flow-server包括流服务器的 IP 地址和端口,并在层次结构级别通过[edit forwarding-options sampling]语句指定interface用于流记录处理的自适应服务接口。
路由器 1
[edit]
interfaces {
   sp-2/0/0 { # This adaptive services interface creates the flow records.
        unit 0 {
            family inet {
                address 10.5.5.1/32 {
                    destination 10.5.5.2;
                }
            }
        }
    }
   ge-1/0/0 { # This is the interface where records are sent to the flow server.
        unit 0 {
            family inet {
                address 10.60.2.2/30;
            }
        }
    }
   ge-2/3/0 { # This is the input interface where all traffic enters the router.
        unit 0 {
            family inet {
                filter {
                   input catch_all; # This is where the firewall filter is applied.
                }
                address 10.1.1.1/20;
            }
        }
    }
   ge-3/0/0 { # This is the interface where the original traffic is forwarded.
        unit 0 {
            family inet {
                address 10.2.2.1/24;
            }
        }
    }
}
forwarding-options {
   sampling { # Traffic is sampled and sent to a flow server.
        input {
           rate 1; # Samples 1 out of x packets (here, a rate of 1 sample per packet).
        }
        family inet {
            output {
               flow-server 10.60.2.1 { # The IP address and port of the flow server.
                    port 2055;
                    version 5; # Records are sent to the flow server using version 5 format.
                }
                flow-inactive-timeout 15;
                flow-active-timeout 60;
                interface sp-2/0/0 { # Adding an interface here enables PIC-based sampling.
                    engine-id 5; # Engine statements are dynamic, but can be configured.
                    engine-type 55;
                    source-address 10.60.2.2; # You must configure this statement.
                }
            }
        }
    }
}
firewall {
    family inet {
        filter catch_all { # Apply this filter on the input interface.
            term default {
                then {
                    sample;
                    count counter1;
                    accept;
                }
            }
        }
    }
}
验证您的工作
要验证您的配置是否正确,请在为主动流监控配置的监控站上使用以下命令:
show services accounting errorsshow services accounting (flow | flow-detail)show services accounting memoryshow services accounting packet-size-distributionshow services accounting statusshow services accounting usageshow services accounting aggregation template template-name name (detail | extensive | terse)(仅限版本 9)
大多数主动流监控作模式命令都包含与以下被动流监控命令等效的输出信息:
show services accounting errors =show passive-monitoring errorshow services accounting flow =show passive-monitoring flowshow services accounting memory =show passive-monitoring memoryshow services accounting status =show passive-monitoring statusshow services accounting usage = show passive-monitoring usage
主动流监控命令可用于大多数主动流监控应用程序,包括采样、丢弃核算、端口镜像和多端口镜像。但是,只能将被动流监控命令用于在层次结构级别包含 [edit forwarding-options monitoring] 监控组的配置。
下面显示了与配置示例一起使用的 show 命令的输出:
user@router1> show services accounting errors
Service Accounting interface: sp-2/0/0, Local interface index: 542
Service name: (default sampling)
  Error information
    Packets dropped (no memory): 0, Packets dropped (not IP): 0
    Packets dropped (not IPv4): 0, Packets dropped (header too small): 0
    Memory allocation failures: 0, Memory free failures: 0
    Memory free list failures: 0
    Memory overload: No, PPS overload: No, BPS overload: Yes

user@router1> show services accounting flow-detail limit 10
Service Accounting interface: sp-2/0/0, Local interface index: 468
Service name: (default sampling)
Protocol   Source         Source  Destination Destination    Packet        Byte
           Address          Port  Address            Port     count       count
udp(17)    10.1.1.2           53  10.0.0.1             53      4329     3386035
ip(0)      10.1.1.2            0  10.0.0.2              0      4785     3719654
ip(0)      10.1.1.2            0  10.0.1.2              0      4530     3518769
udp(17)    10.1.1.2            0  10.0.7.1              0      5011     3916767
tcp(6)     10.1.1.2           20  10.3.0.1             20         1        1494
tcp(6)     10.1.1.2           20  10.168.80.1          20         1         677
tcp(6)     10.1.1.2           20  10.69.192.1          20         1         446
tcp(6)     10.1.1.2           20  10.239.240.1         20         1        1426
tcp(6)     10.1.1.2           20  10.126.160.1         20         1         889
tcp(6)     10.1.1.2           20  10.71.224.1          20         1        1046

user@router1>  show services accounting memory
Service Accounting interface: sp-2/0/0, Local interface index: 468
Service name: (default sampling)
  Memory utilization
    Allocation count: 437340, Free count: 430681, Maximum allocated: 6782
    Allocations per second: 3366, Frees per second: 6412
    Total memory used (in bytes): 133416928, Total memory free (in bytes): 133961744

user@router1>  show services accounting packet-size-distribution
Service Accounting interface: sp-2/0/0, Local interface index: 468
Service name: (default sampling)
Range start     Range end     Number of packets     Percentage packets
         64            96               1705156                    100

user@router1>  show services accounting status
Service Accounting interface: sp-2/0/0, Local interface index: 468
Service name: (default sampling)
  Interface state: Monitoring
  Group index: 0
  Export interval: 60 secs, Export format: cflowd v5
  Protocol: IPv4, Engine type: 55, Engine ID: 5
  Route record count: 13, IFL to SNMP index count: 30, AS count: 1
  Time set: Yes, Configuration set: Yes
  Route record set: Yes, IFL SNMP map set: Yes

user@router1>  show services accounting usage
Service Accounting interface: sp-2/0/0, Local interface index: 468
Service name: (default sampling)
  CPU utilization
    Uptime: 4790345 milliseconds, Interrupt time: 1668537848 microseconds
    Load (5 second): 71%, Load (1 minute): 63%