自动监控设备运行状况并检测异常情况
通过本主题了解 Paragon Automation 如何自动监控设备运行状况并检测异常,以及如何使用 GUI 查看与设备运行状况相关的异常。
设备运行状况监控和异常检测概述
-
设备运行状况和异常检测是此版本中的一项测试版功能。
-
要监控设备运行状况,您必须在安装 Paragon Automation 群集时启用 AI/ML (
install-aiml) 和设备运行状况监控 (enable-device-health)。有关详细信息,请参阅 部署集群。
要确定网络的运行状况,您需要监控网络中设备的运行状况。Paragon Automation 使用 AI/ML(人工智能 [AI] 和机器学习 [ML])技术自动监控与设备运行状况相关的关键性能指标 (KPI),并自动检测发生的任何异常情况。Paragon Automation 还会在设备运行时对设备温度异常执行根本原因分析 (RCA)。
通过定期监控设备的运行状况并及时检测到设备运行状况异常,运维人员能够采取行动,将任何问题的影响降至最低
Paragon Automation 会在以下场景中监控设备运行状况:
-
设备上线期间 — 设备上线时,Paragon Automation 会监控设备的运行状况,并在出现任何异常时生成警报。
在接入设备时,如果存在之前接入的相同型号的其他设备,Paragon Automation 会比较数据以检测异常情况。但是,如果特定型号的设备是首次上线,则由于缺乏历史数据,异常检测的效果会受到限制。
-
设备运行期间 — 设备成功上线并得到管理后,Paragon Automation 会持续监控与设备运行状况相关的 KPI。对于每台设备的每个 KPI,Paragon Automation 会监控该 KPI,预测范围并检测发生的任何异常情况。在设备运行期间,Paragon Automation 会根据该设备的历史数据和预测范围检测设备运行状况异常(30 分钟内)。
在验证阶段,观察到设备运行状况监控中使用的 ML 模型的 MAPE 分数在 2.5 到 6.5 之间变化。
温度异常的 RCA
当设备运行时,Paragon Automation 会针对与路由引擎温度和路由引擎 CPU 温度相关的问题提供 RCA。Paragon Automation 会分析可能导致温度问题的不同属性(CPU 利用率百分比、风扇转速百分比和进气口温度)。Paragon Automation 还会将设备的温度与预期范围进行比较。根据分析和比较,Paragon Automation 会提供警报、问题的预期原因以及可能导致问题的事件的详细信息。 图 1 显示了一个示例页面,显示了路由引擎温度异常的 RCA 日志。
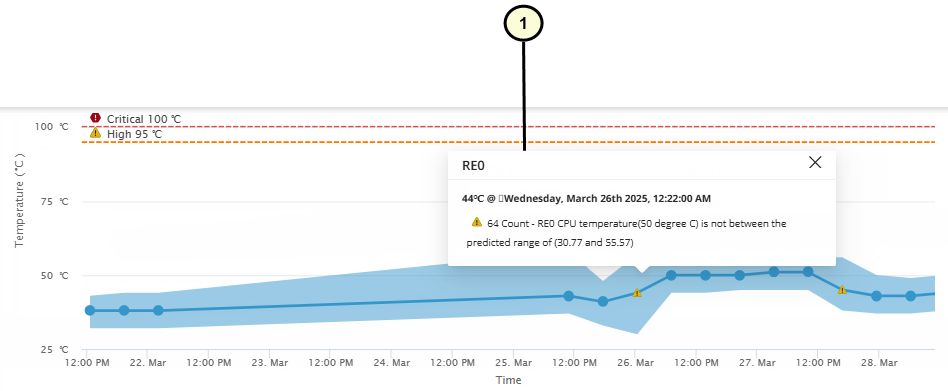 RCA 的示例页面
|
1
—
设备温度 RCA 详细信息 |
设备运行状况 KPI
表 1 显示了 Paragon Automation 针对每台设备监控的设备运行状况 KPI。
| KPI | 组件 | 参数 |
|---|---|---|
| 中央处理器 | 路由引擎 线卡 |
CPU 利用率百分比 (%) |
| 记忆 | 路由引擎 线卡 |
内存利用率百分比 (%) |
| 扇 | 不適用 | RPM 百分比 (%) |
| 温度 |
|
当前温度 |
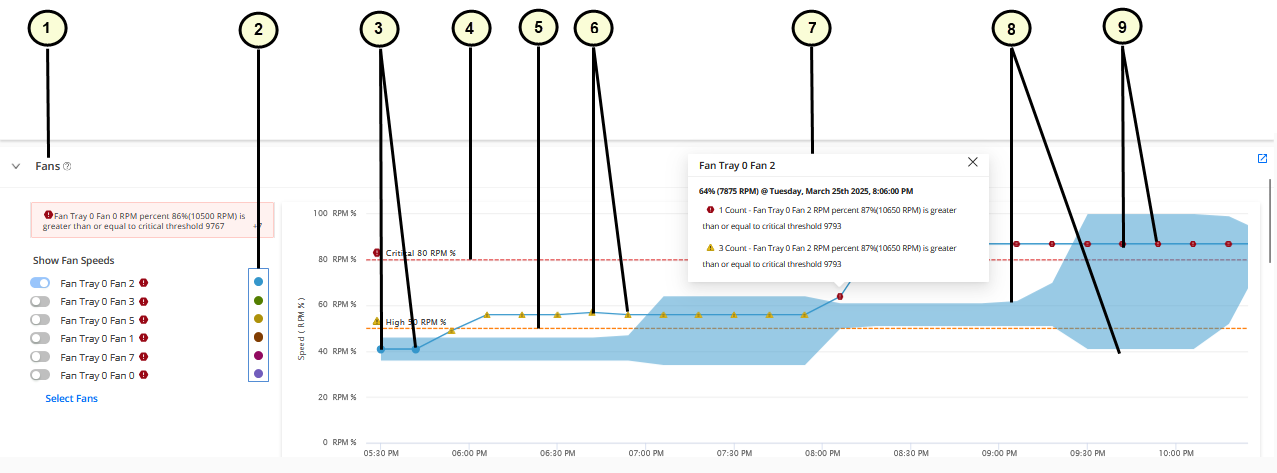
GUI 中的设备运行状况异常
您可以在页面 Device-Name 的“硬件”折叠式上查看和监视设备的设备运行状况异常。
要查看和监控设备运行状况异常,请执行以下作:
For more information on the hardware accordion, see Hardware Data and Test Results.
|
1
—
KPI |
6
—
Triangle icons indicating an anomaly when the higher threshold is breached. |
|
2
—
Legend showing the colors for different sub-components used in the graphs |
7
—
Pop-up showing details of device health anomaly |
|
3
—
Circle icons indicating that the KPI is normal |
8
—
Upper and lower boundaries (dynamic thresholds) for the data displayed in the graph |
|
4
—
Critical threshold marker |
9
—
Hexagon icons indicating an anomaly when the critical threshold is breached. |
|
5
—
High threshold marker |