关于仪表板页面
Juniper Data Center Assurance 仪表板提供有关数据中心网络和托管服务性能的运维洞察。这些洞察使网络管理员能够快速响应影响最终用户体验的网络问题。
要访问此页面,请单击主菜单中的 仪表板 。仪表板在三个选项卡中提供信息: 概览、 地理视图 和 拓扑。
“概述”选项卡
“概述”选项卡提供数据中心网络的三个视图:单个站点、站点组以及组织中您根据用户角色有权访问的所有站点。站点级视图提供有关站点中设备、设备角色、设备异常、影响分析信息等的信息,这些信息显示在一组预定义的小组件中。这些小部件中的信息将根据所选站点的可用信息进行更新。
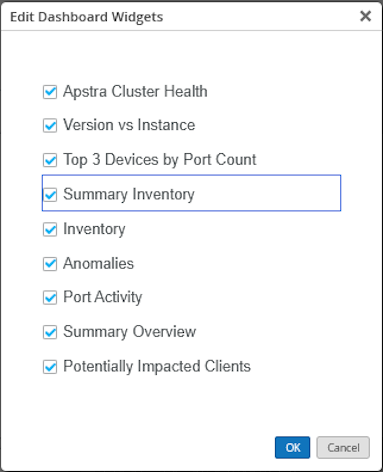
您可以选择所需的小组件,并自定义它们在“ 概述 ”选项卡中的显示方式。单击页面右上角的 编辑 (铅笔)图标,以在“ 概述 ”选项卡中显示或隐藏小部件。此外,您还可以根据布局偏好调整小部件的大小或重新排序。单击任何小部件右上角的省略号 (...) 可刷新显示的信息、调整大小或重新排序小部件的布局,如 图 1 所示。
您还可以创建自定义仪表板,通过单击“ 添加选项卡”来根据网络要求监控特定洞察。然后,您可以添加所需的小部件。
In this demo scenario, we'll walk through how Juniper Data Center Assurance helps quickly detect and resolve issues impacting critical workloads in the data center. In this case, we have some critical virtual machines running our CRM and GitHub applications. The scenario begins with a notification from the IT help desk informing us that users are reporting problems with the CRM application. The network team knows the importance of this system and must quickly investigate this issue.
The affected users are trying to reach IP address 10.70.70.9, but haven't been able to access the CRM application since 8:00 a.m. The enterprise IT team has already ruled out WiFi and access point issues. Everything looks fine on that end. So, the focus now shifts to the data center.
As the network admin, the first step is to enter Juniper Data Center Assurance. Once logged in, the Dashboard provides a high-level view of the data center showing inventory, current network status, and any detected anomalies. On the right side of the screen, the Anomalies panel displays a list of ongoing issues along with Impact Analysis widget that highlights what part of the networks are affected.
The admin suspects the anomalies may be related to the CRM issue and decides to confirm whether the client IP was actually reaching the data center. Navigating to the Service Aware screen, the admin opens the Service Topology view to examine client connection attempts during the reported time frame.
The CRM application is running on port 8069. Clicking on the CRM tile reveals the service topology, the port it's running on, the client IP is attempting to connect, and the VMs and compute resources involved.
The admin confirms that the client IP mentioned in the problem report indeed tried to reach this service.
Next, to check for correlation with the anomalies, the admin opens the Impact Analysis screen. By selecting the affected time frame, a visual graph displays service impacts in the 15-minute intervals, helping narrow down exactly when the issue began and which services were affected.
In the 7:30 to 7:45 a.m. window, no issues are found. But from 7:45 to 8:00 a.m., anomalies appear. specifically a link status mismatch. Expanding the graph shows detailed host data. The mismatch appears on Leaf2 - FX04. This is directly connected to ESX01 - the host running the CRM VM.
The anomaly report confirms service impact showing traffic from 10.70.70.9 - the same IP from the initial client report to verify the issue from the virtualization side. The network admin contacts the VI admin.
He logs into the vSphere client. There is a Network Connectivity Lost alarm and it's active.
Checking the alarm details, the VI admin confirms that the distributed virtual switch ports lost connectivity due to a physical link being down. This affects the port groups tied to the CRM VM. The outage outlines perfectly with the time of the reported issue.
The VI admin knows that both the CRM and the GitHub VMs are critical systems. Since the CRM VM is impacted, this issue is escalated and prioritized.
The network admin logs into Apstra, navigates to the relevant blueprint, and confirms the presence of a generic system connectivity anomaly. This indicates that the interface connected to the ESXI host is down. Further investigation reveals that a disable-interface configlet has been applied. This is what has disabled the interface. To resolve it, the admin removes the configlet, brings the interface back online. This change is committed to update the interface configuration.
Afterwards, they notify the enterprise admin to check connectivity to the application.
Initially, it's still unreachable, but shortly after, the client is able to connect. They confirm that the CRM application is now accessible and functioning properly and there are no issues navigating through it.
We've demonstrated full end-to-end assurance with Juniper Data Center Assurance - starting with the user's issue
identifying the root cause via anomalies in the fabric and resolving a network connectivity loss that was impacting a critical VM in the data center.
为站点组和所有站点显示的小组件
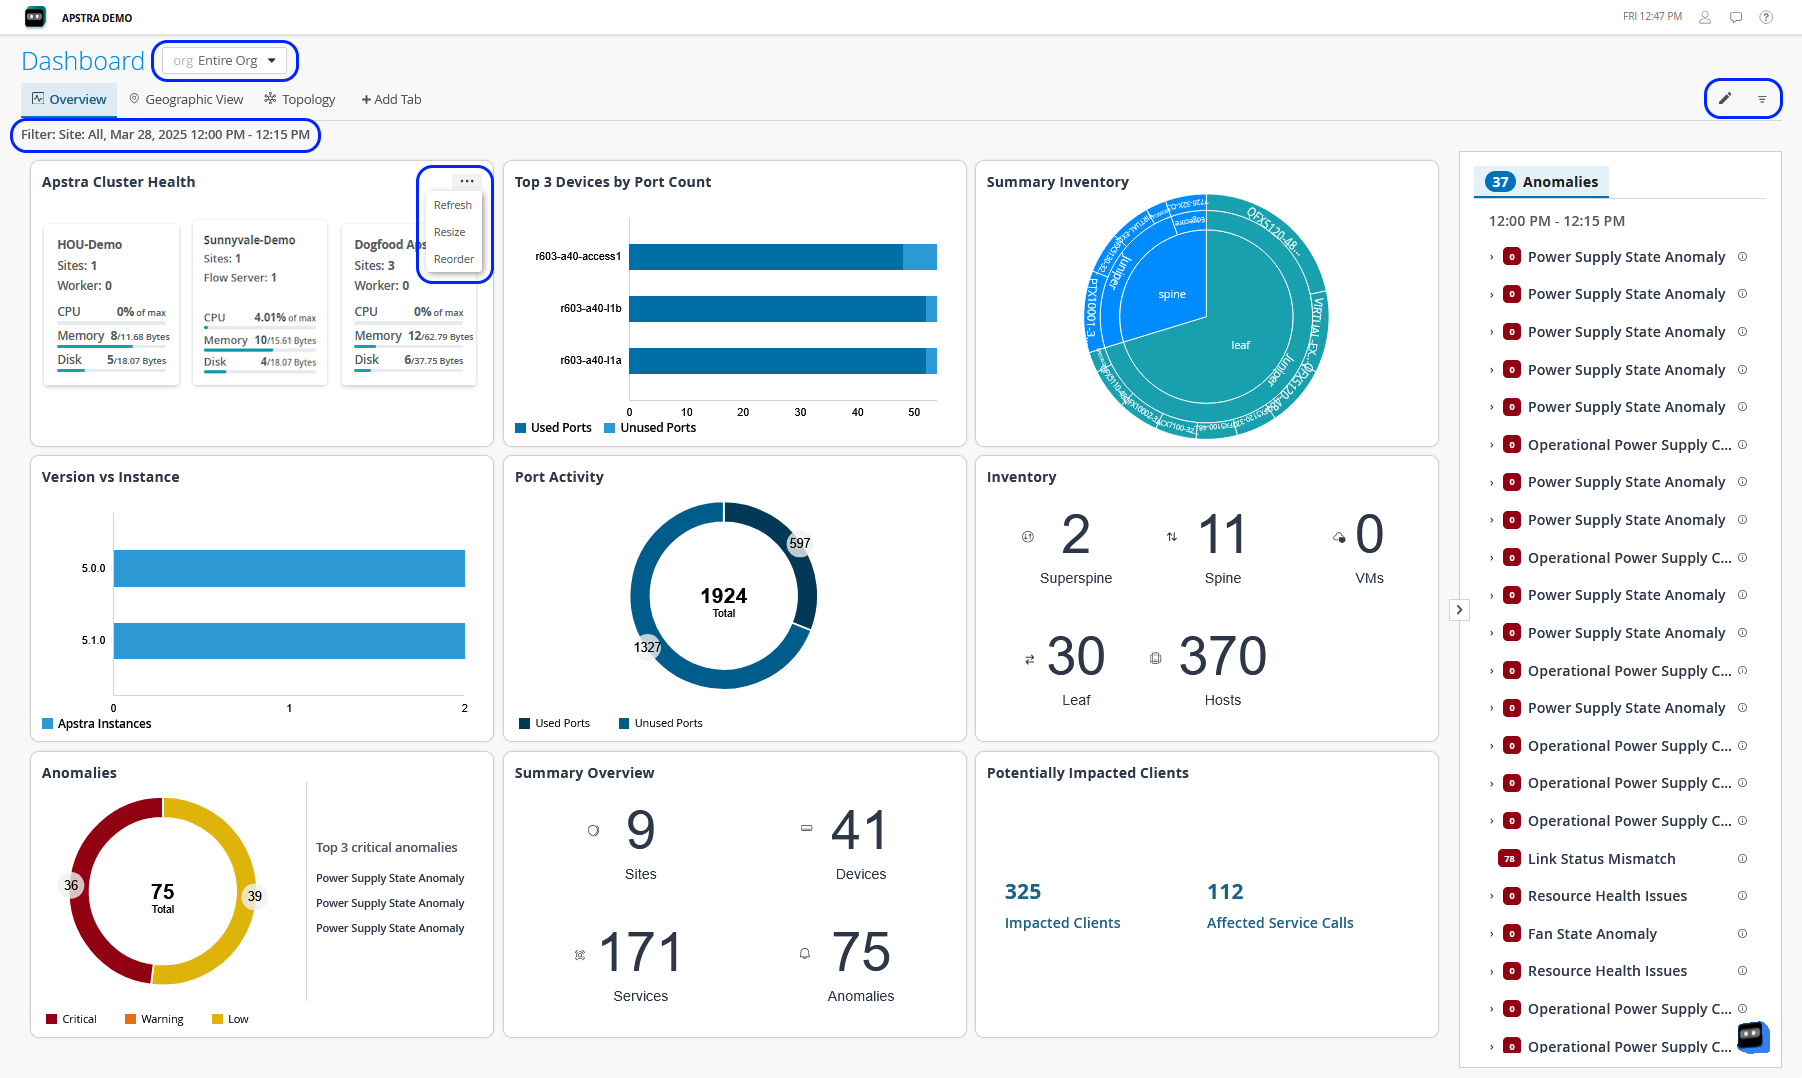
在“ 概述 ”选项卡中,您还可以查看站点组或组织中您根据用户角色有权访问的所有站点的信息。使用页面顶部的筛选器选择网站组或 “所有网站”。选择站点组或 所有站点 后,小组件将显示有关 Apstra 控制器、安装的 Apstra 版本等的信息。 图 1 显示了选择站点组或“所有站点”时“ 概述 ”选项卡的外观。
 的“概览”选项卡
| 小部件名称 |
描述 |
|---|---|
| Apstra 群集运行状况 |
显示整个组织或站点组中 Apstra 群集内的控制器总数。它还提供了每个控制器的 CPU、内存和磁盘利用率、站点计数、辅助角色计数和远程服务器计数的摘要。选择单个控制器以展开视图并查看其工作节点和流服务器的详细信息。您还可以选择工作节点或流服务器来查看其历史数据。 |
| 版本与实例 |
正在运行的 Apstra 实例数及其版本。 |
| 端口数量排名前 3 的设备 |
显示一个图表,按端口数量列出了前三名设备。 |
| 摘要清单 |
显示有关组织或站点组中的超级主干、主干、叶和主机设备的分层信息。 |
| 库存 |
显示数据中心中的设备总数及其角色。 |
| 异常 |
显示按严重性级别分类的异常总数,例如严重、警告和低。该磁贴还列出了需要立即关注的前三个严重异常。 |
| 端口活动 |
显示组织或站点组中的端口总数,以及已用端口和未使用端口的图表。 |
| 摘要概述 |
提供有关站点、设备、服务的总数以及生成的异常总数的信息。 |
| 可能受影响的客户端 |
提供因异常而受到影响的客户端总数以及受影响服务的总数。 |
为单个站点显示的小部件
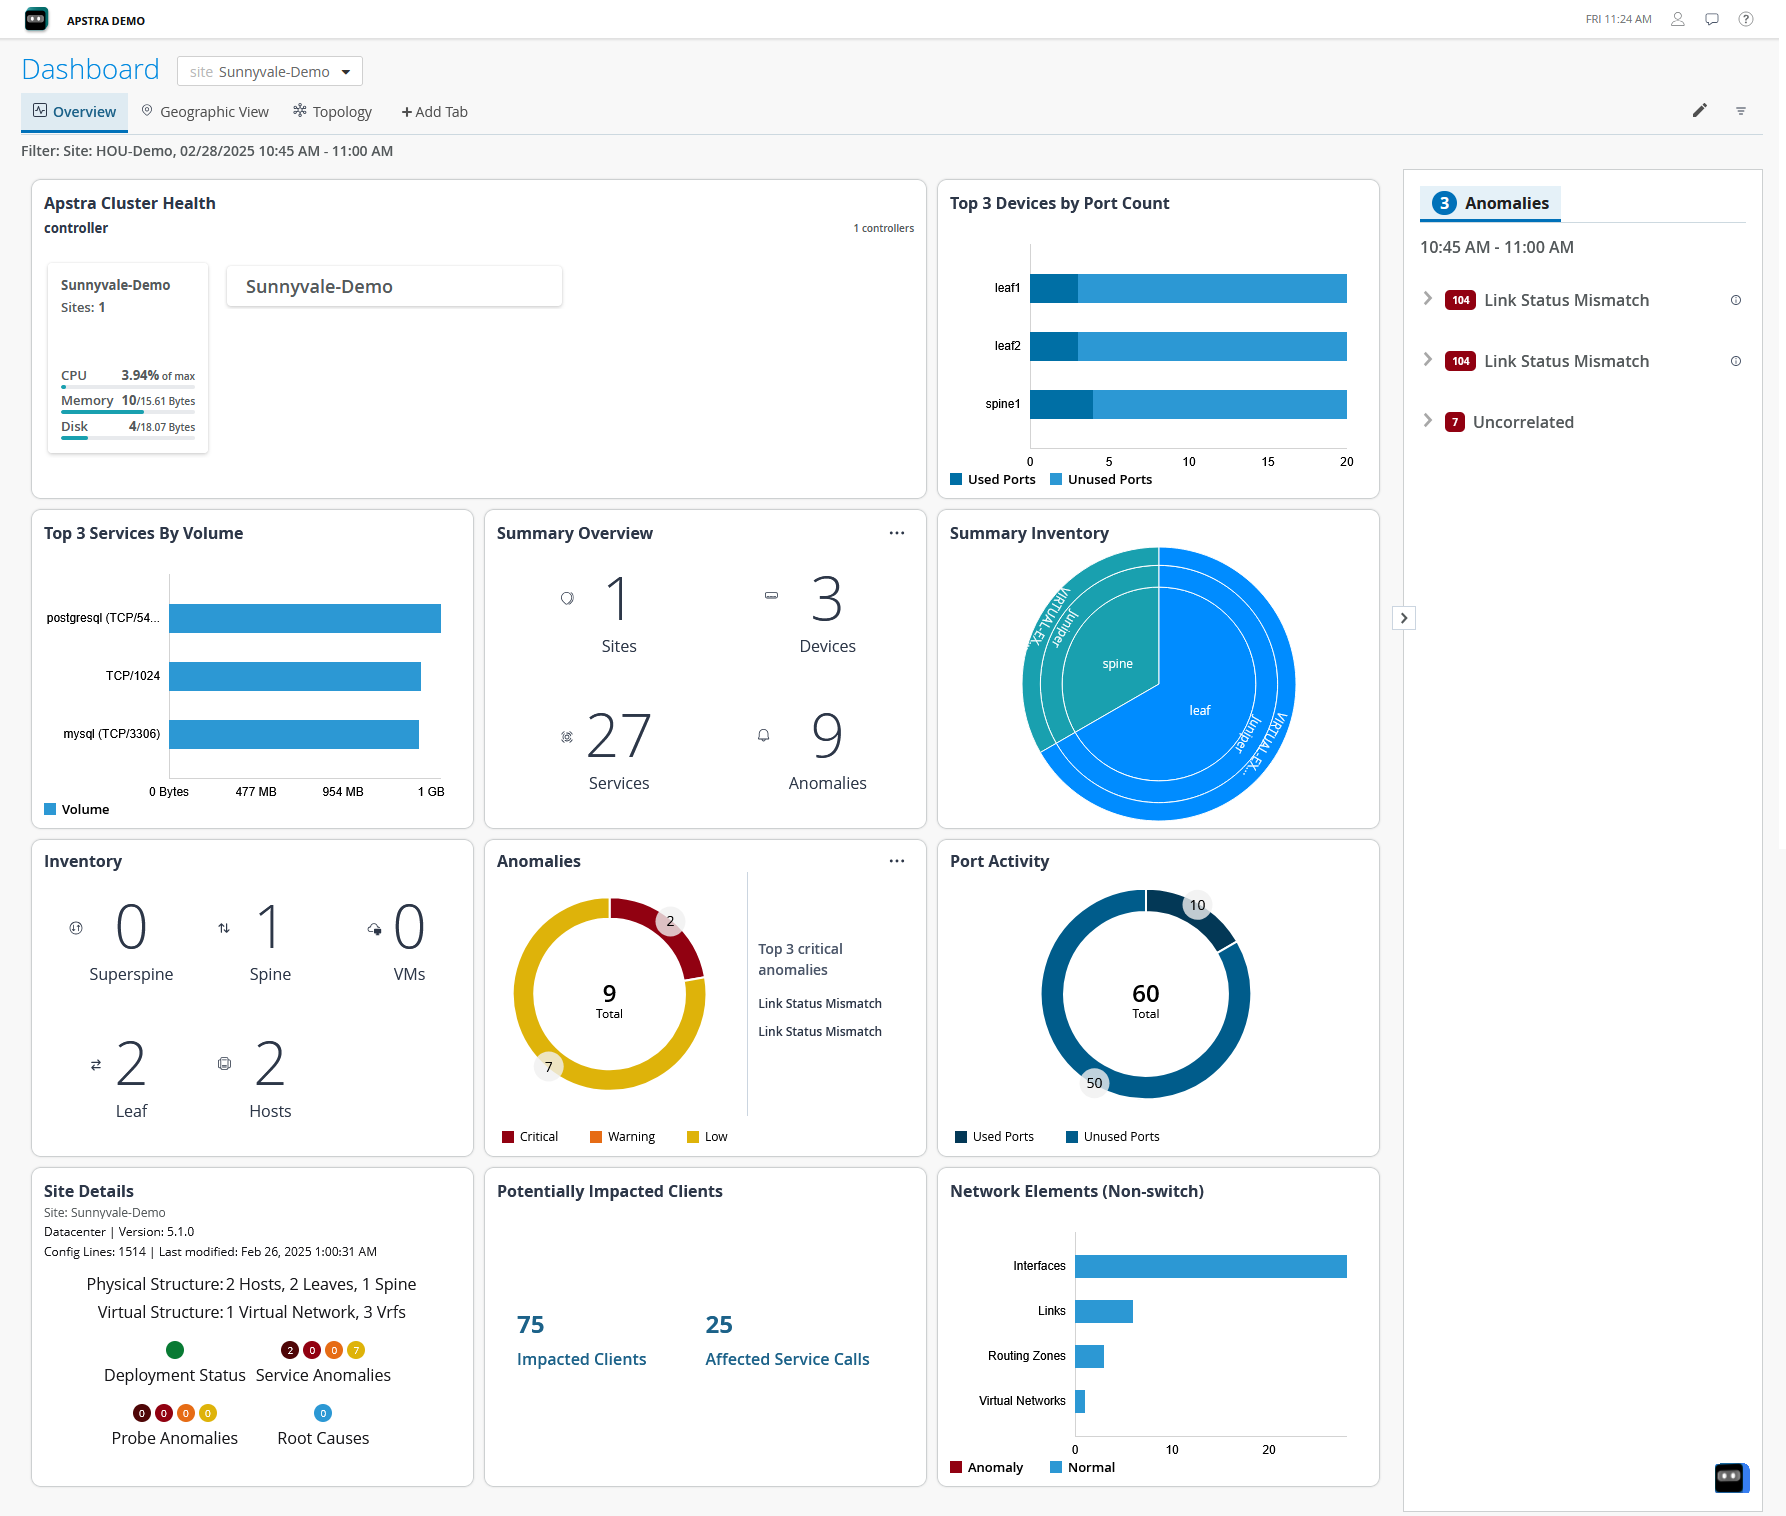
您可以选择单个站点以在 “概述 ”选项卡中查看站点级信息。页面上的小组件提供特定于所选站点的信息。 图 2 显示了单个站点的 Overview 选项卡上显示的小部件。
 显示的小部件
在 图 2 中,右窗格中的 Key Anomalies 小组件和 Anomalies 选项卡未显示任何数据,因为您选择的站点中没有报告异常。小部件将根据所选站点的可用信息进行更新。 表 2 介绍了为单个站点显示的小部件。
| 小部件名称 |
描述 |
|---|---|
| Apstra 群集运行状况 |
显示所选站点的 Apstra 群集中的控制器以及与之关联的所有工作节点和远程服务器。它还提供控制器以及每个工作器节点和流服务器的 CPU、内存和磁盘利用率、站点计数和辅助角色计数的摘要。您可以选择工作节点或流服务器来查看其历史数据。 |
| 端口数量排名前 3 的设备 |
显示一个图表,按端口数量列出了前三名设备。 |
| 按数量排名前 3 的服务 |
显示一个图表,按数据量列出了前三个服务。 |
| 摘要概述 |
显示站点中的设备和活动服务的数量以及生成的异常计数。 |
| 摘要清单 |
显示有关站点中的超级主干、主干、叶和主机设备的分层信息。 |
| 库存 |
显示数据中心中的设备总数及其角色。 |
| 异常 |
显示前三个关键异常以及站点中生成的异常总数。 |
| 端口活动 |
显示站点中的端口总数以及已用端口和未使用端口的图表。 |
| 网站详细信息 |
显示 Apstra 版本、物理和逻辑系统的数量以及报告的异常情况。 |
| 可能受影响的客户端 |
显示受影响的客户端和服务总数。 |
| 网络元素(非交换机) |
显示网络中不同非交换机元素的数量。还显示了在每种元素类型中具有异常和正常运行的元素数。 |
异常
右窗格中的“ 异常 ”选项卡显示已发生的异常,还指示异常与关键异常的关系。异常可能会触发多个相关事件。展开关键异常,查看与关键异常相关的异常的详细列表。通常,当触发这些异常的事件得到解决时,生成的相关事件会自动解决。此类事件或异常称为关键异常。识别并标记关键异常可帮助管理员更快地解决问题。识别并标记关键异常还有助于减少告警疲劳,这是由于不同严重级别的异常数量过多,管理员可能会面临这种情况。警报疲劳可能会导致对异常情况的响应延迟,有时甚至会忽略严重的异常情况。
“地理视图”选项卡
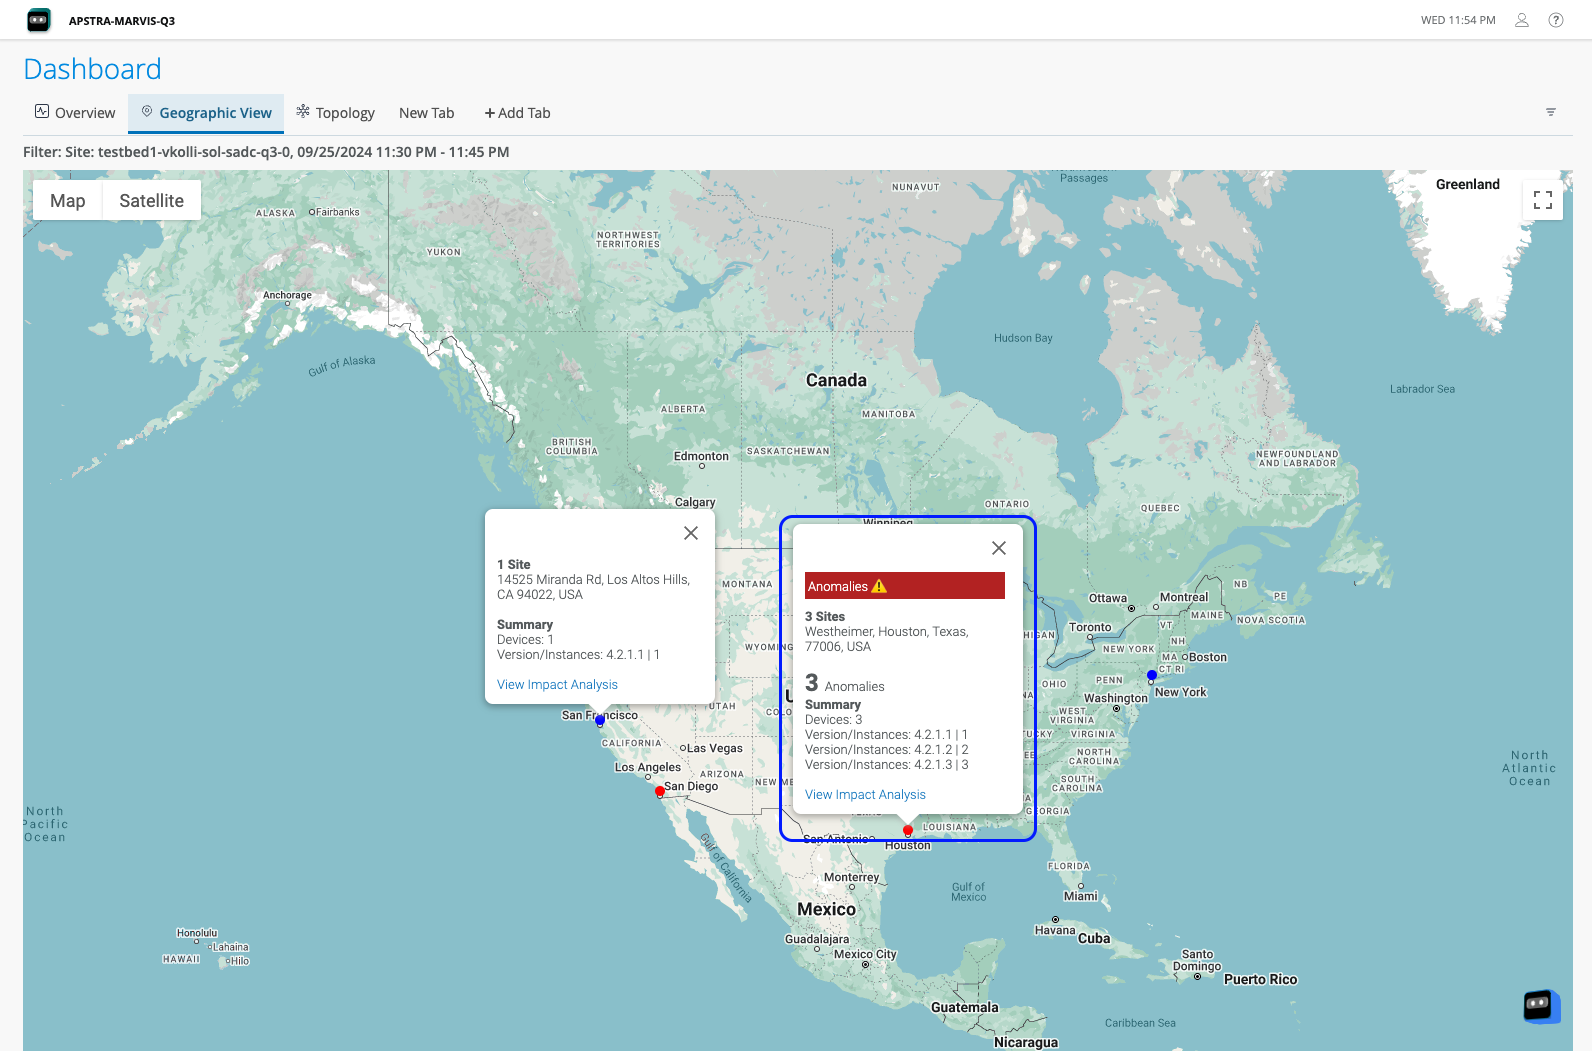
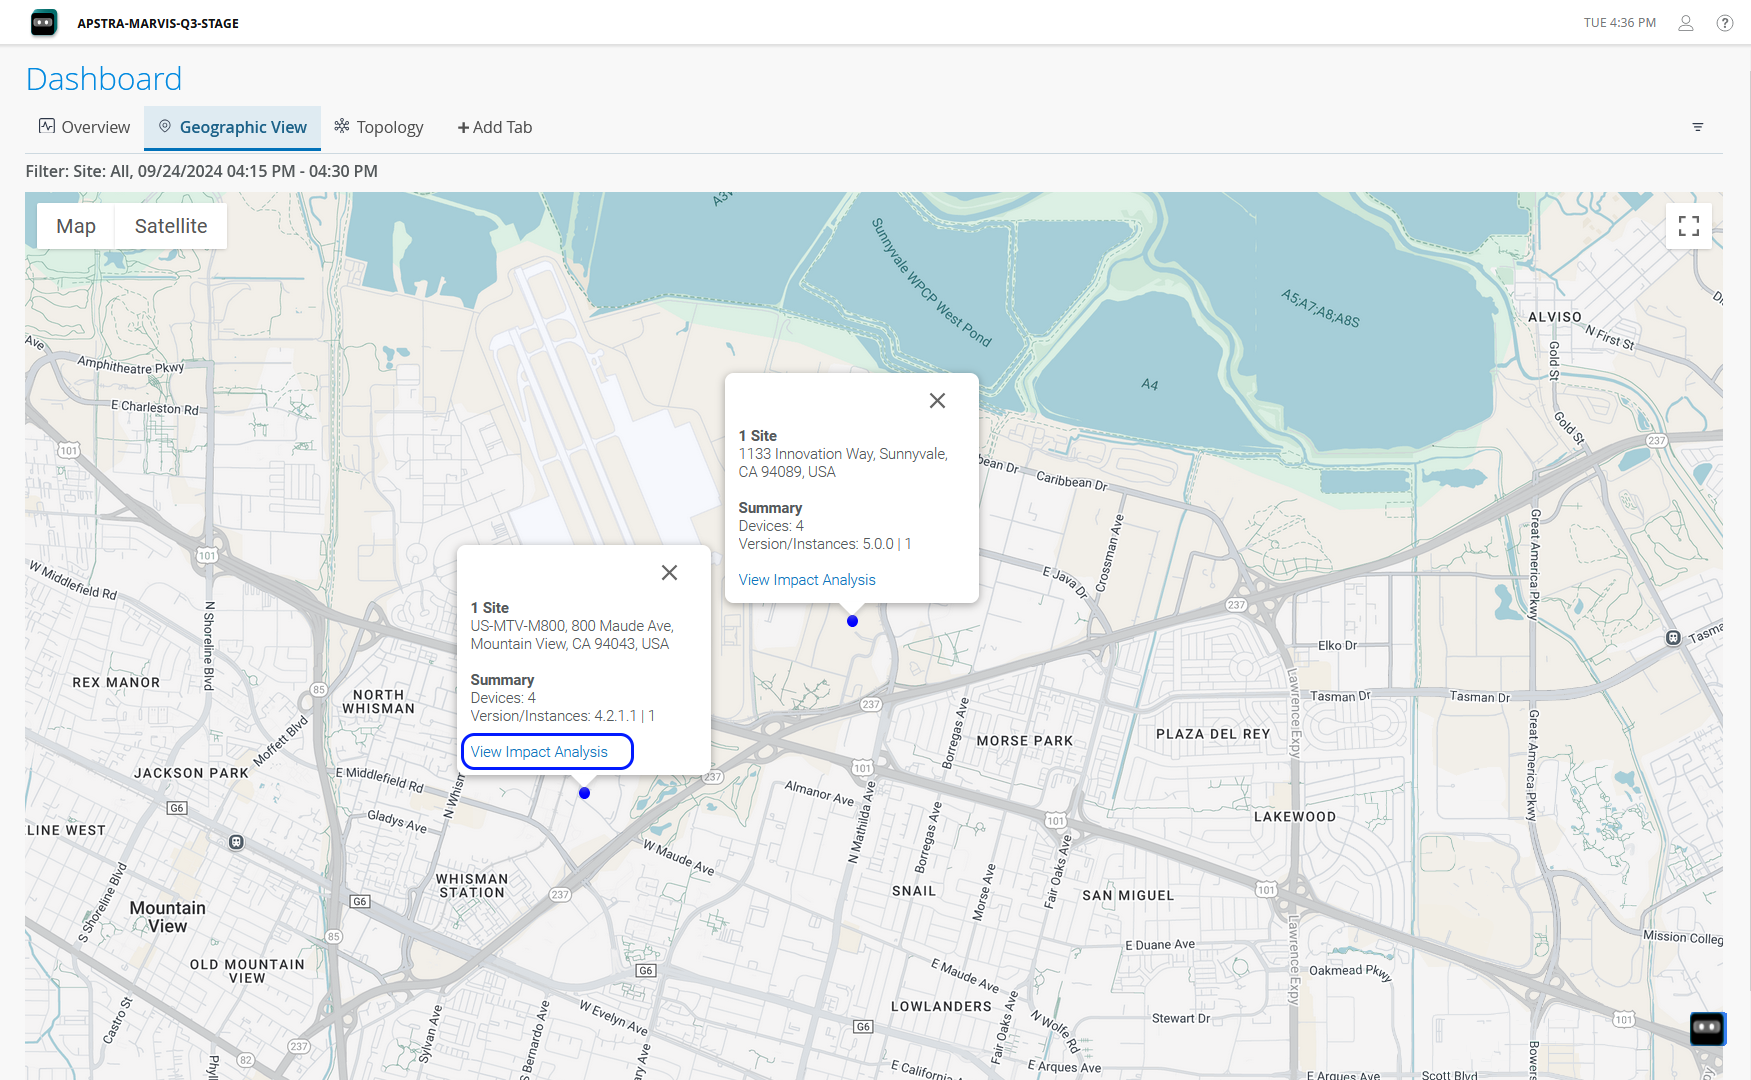
“ 地理视图” 选项卡有助于查看地图上站点的位置、设备数量以及设备中的异常情况(如果有)。如果站点运行正常,则地图上的站点图标将显示为蓝色。如果站点中报告了异常,则图标显示为红色,如 图 3 所示。将鼠标悬停在图标上可查看站点详细信息。在弹出的窗口中,您可以查看站点信息,例如站点中的设备数量、站点中安装的 Apstra 版本以及 Apstra 实例的数量。
 的地理视图
的地理视图
单击该图标可放大到该站点在城市地图上的确切位置。单击 “View Impact Analysis” ,如 图 4 所示。系统会提示您选择站点。选择站点后,您将被重定向到 “影响分析” 页面。
拓扑选项卡
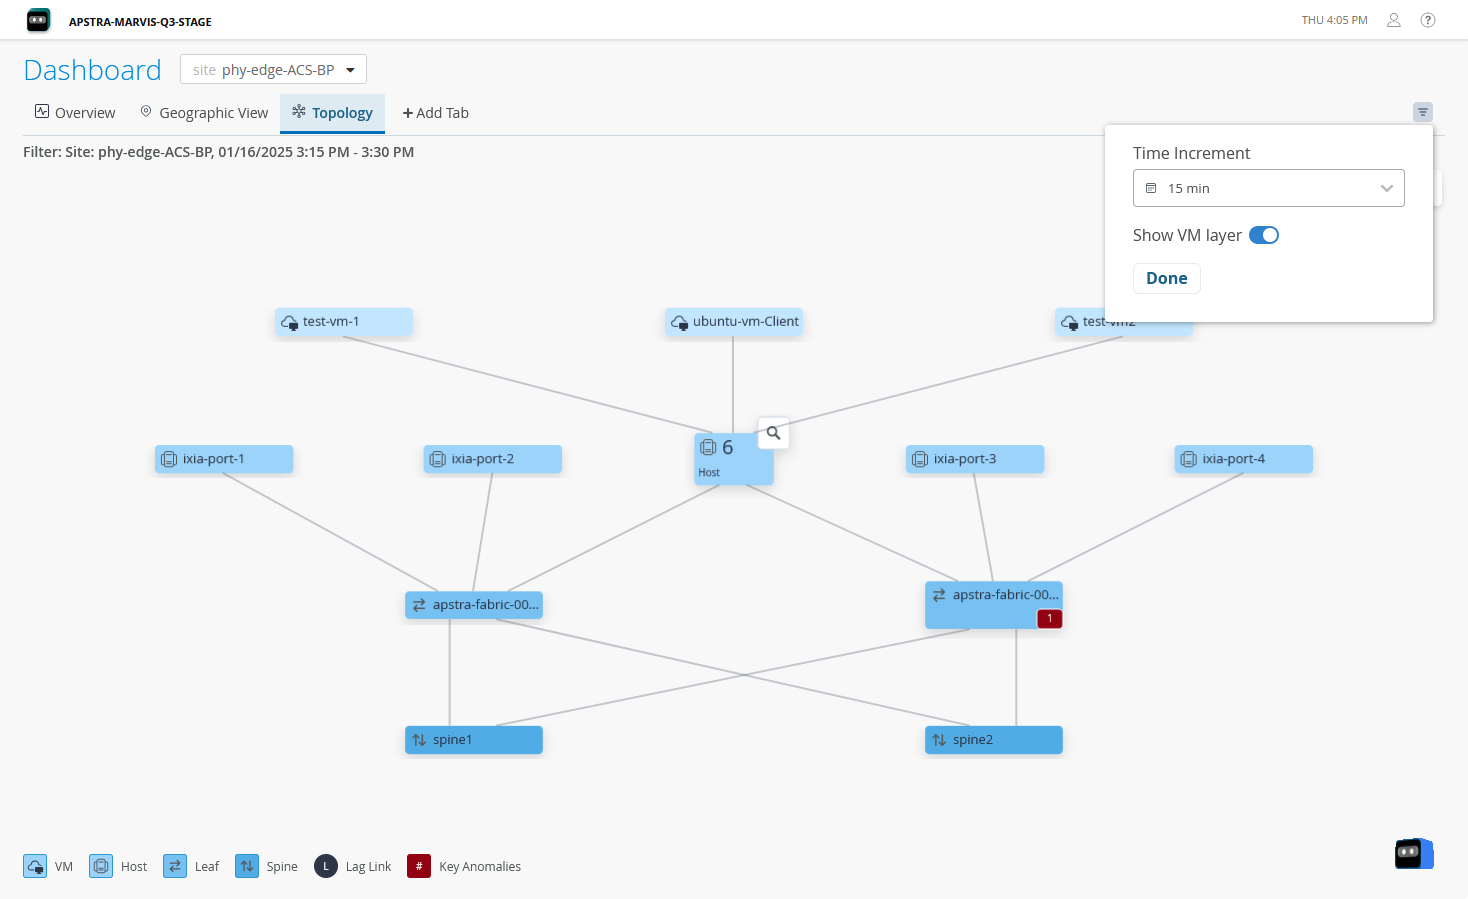
拓 扑视图 选项卡以图形形式呈现数据中心交换矩阵的物理拓扑,提供有关设备如何相互连接、设备的角色以及设备中生成的异常计数(如果有)的信息。拓扑视图以三层形式显示数据中心网络:主机、枝叶和主干。您还可以通过启用“ 显示虚拟机层 ”切换按钮来查看拓扑中的虚拟机连接。
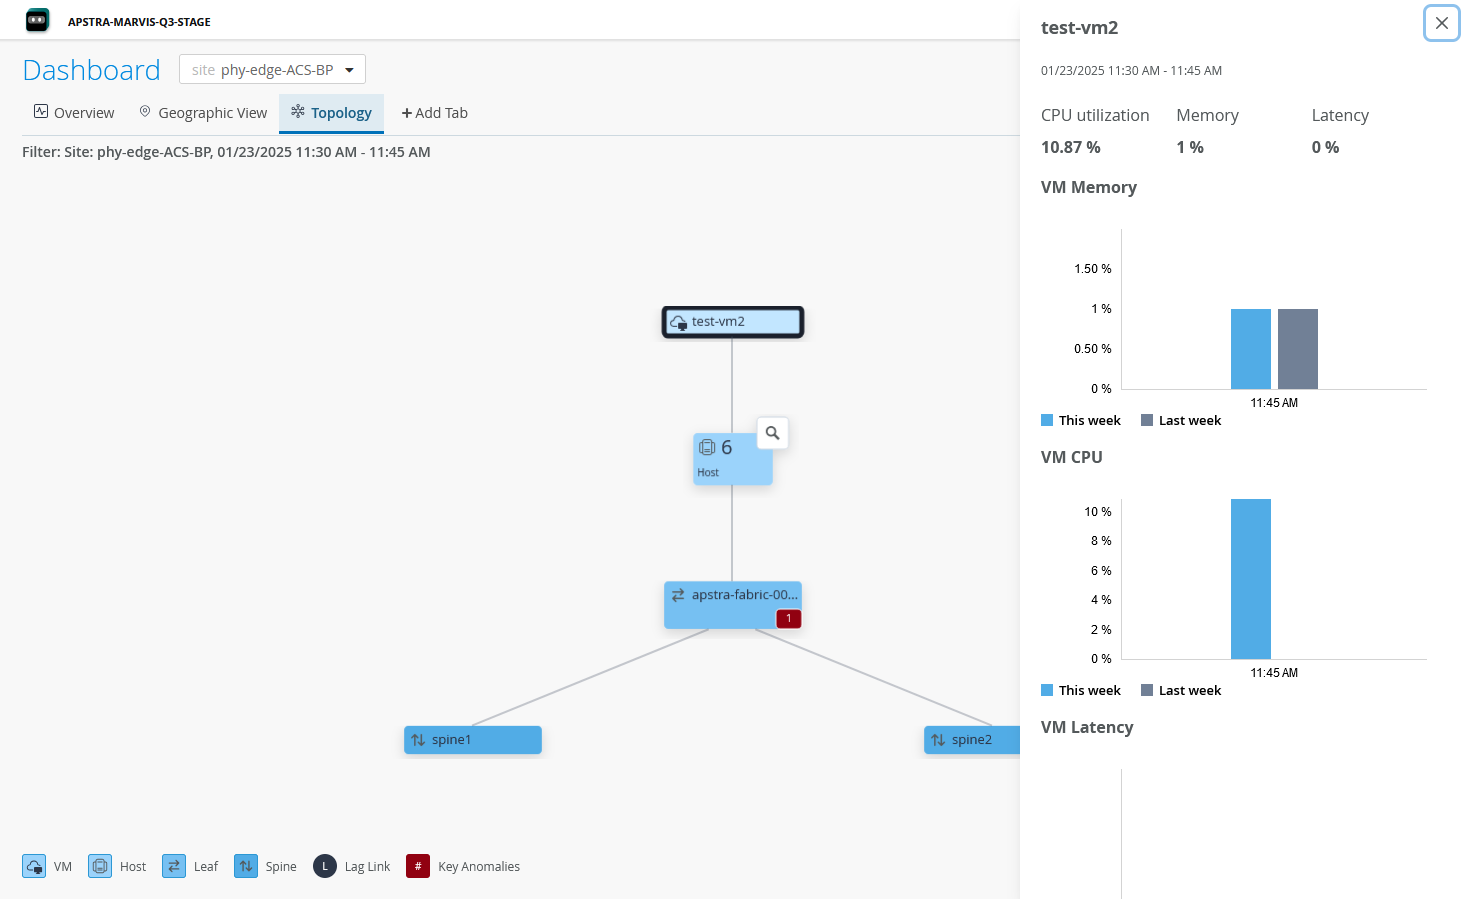
除此之外,您还可以查看拓扑中特定节点的详细信息。单击一个节点可在右侧窗格中查看设备信息,例如 CPU 和内存利用率,如 图 6 所示。
仪表板上的辅助功能
DC Assurance 仪表板符合万维网联盟 (W3C) 的 Web 内容辅助功能准则 2.1 (WCAG)。
W3C 是一家帮助制定 Web 标准和准则以适应不断多样化的人群、硬件和软件的组织。WCAG 是一套准则,旨在为 Web 内容辅助功能提供单一的共享标准,以满足国际上个人、组织和政府的需求。这些准则说明了如何使 Web 内容更容易被广泛的受众访问,包括使用辅助工具查看的用户。
使用屏幕阅读器的用户可以访问该仪表板,例如运行 Windows 的设备的 非可视桌面访问 (NVDA) 或 Apple 设备内置的 VoiceOver。您可以使用屏幕阅读器和表 3 中列出的键盘快捷键来导航仪表板元素并与之交互。
| 行动 |
快捷键 |
|---|---|
| 向前导航 |
选项卡 |
| 向后导航 |
Shift + Tab |
| 选择、取消选择、打开 |
Enter / 空格 |
| 在选项之间导航 |
向上箭头 / 向下箭头 |
| 结束 |
Esc |
使用键盘导航时,所选元素将突出显示,如 图 7 所示。